If 2024 was about signalling change, 2025 was the year reforms arrived en masse.
For Whitehall, it was a year of ‘simplification’, ‘streamlining’ and ‘cutting red tape’ across apprenticeships, inspections, qualifications and funding. For FE Week readers though, it was a year of added complexity; a redistribution, rather than removal, of bureaucracy and risk.
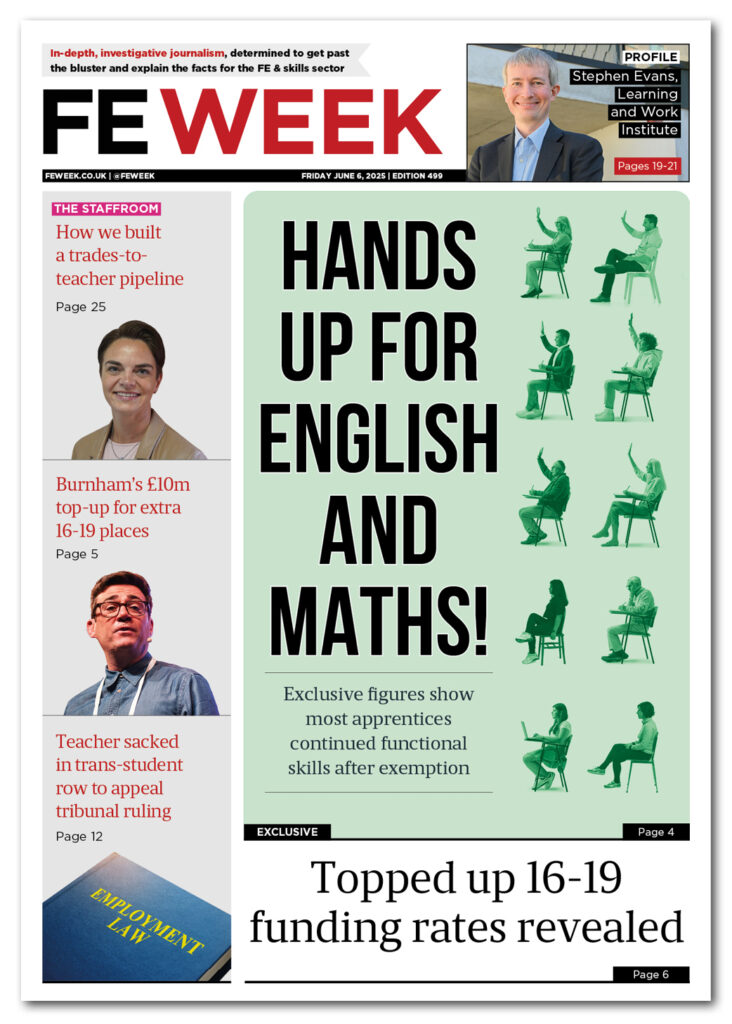
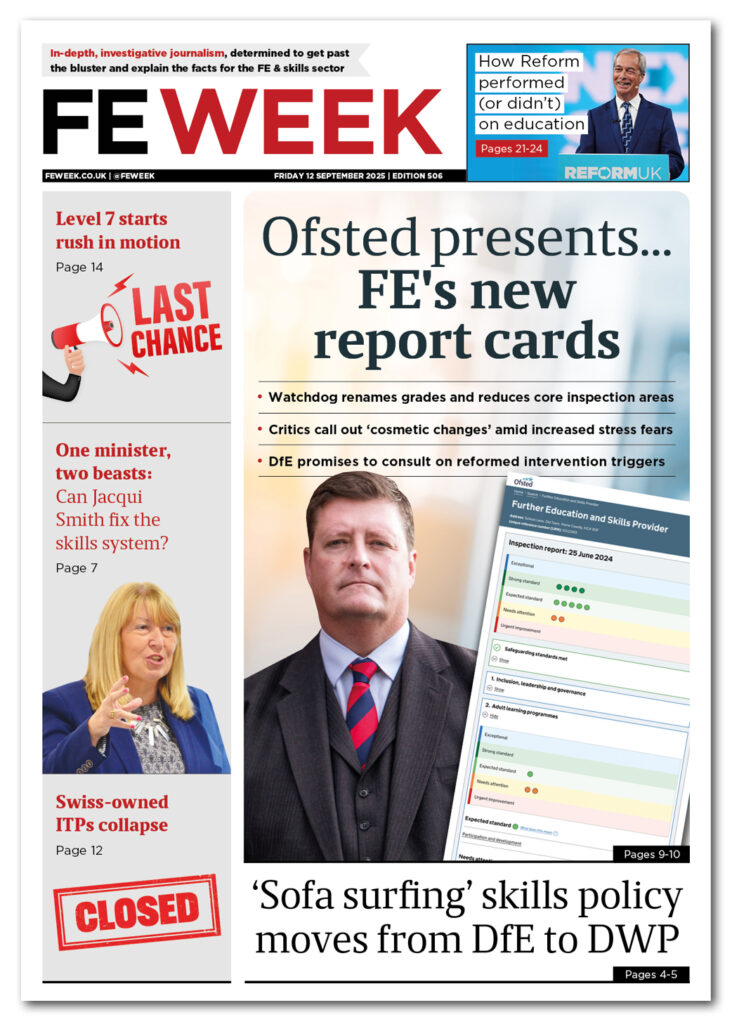
Ofsted scrapped the overall effectiveness grade but replaced it with more graded judgments. Some apprenticeship English and maths rules were relaxed, but providers are now navigating grey areas around assessment, duration and quality. And years of ‘will they, won’t they’ over scrapping BTECs was finally settled. They will, with yet another new government-driven level 3 vocational qualification.
If that gap between rhetoric and reality wasn’t clear enough already, we had Keir Starmer’s summer conference speech declaring further education a “defining mission” for his government. Typical, isn’t it, that such a commitment was to come from a prime minister at a time when his own position looks increasingly uncertain.
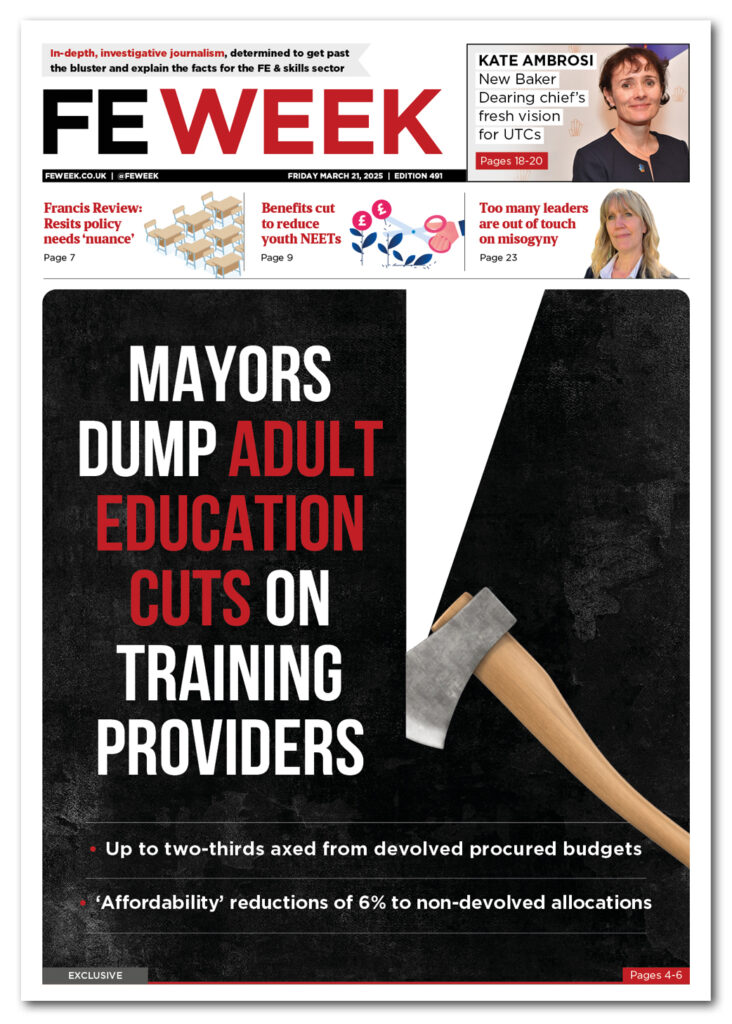
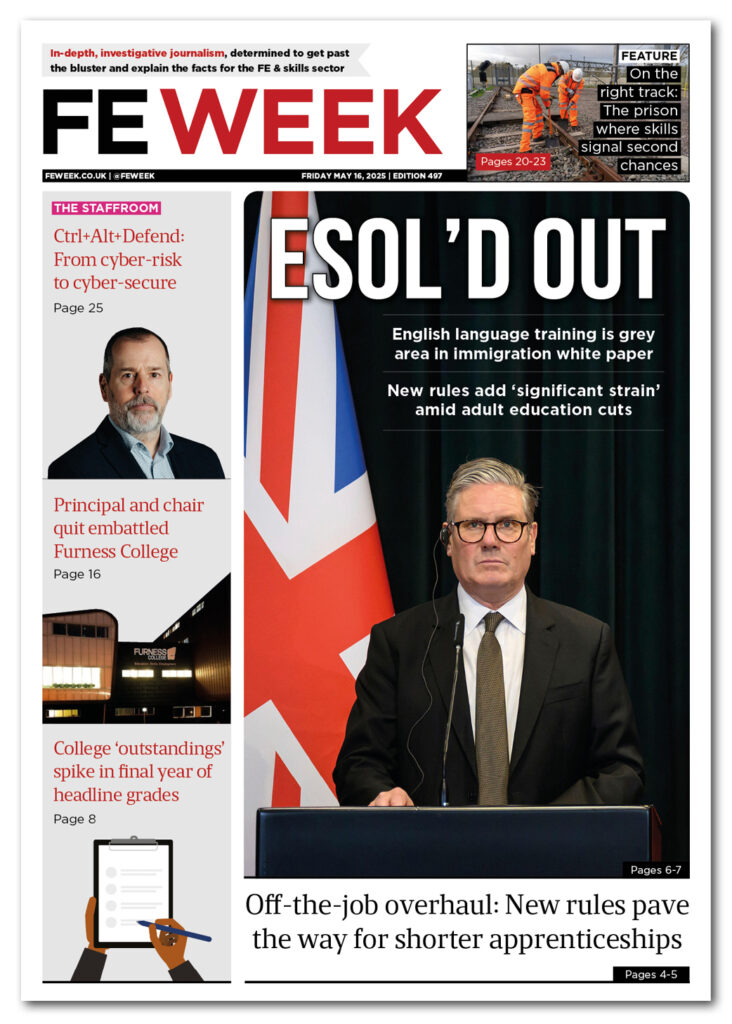
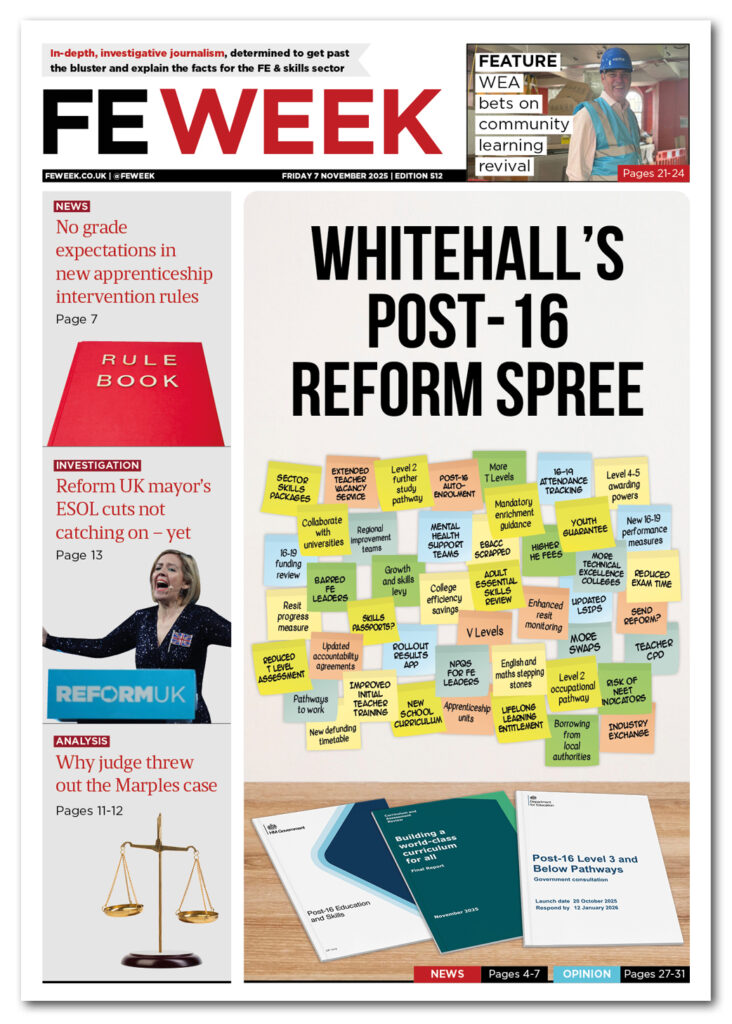
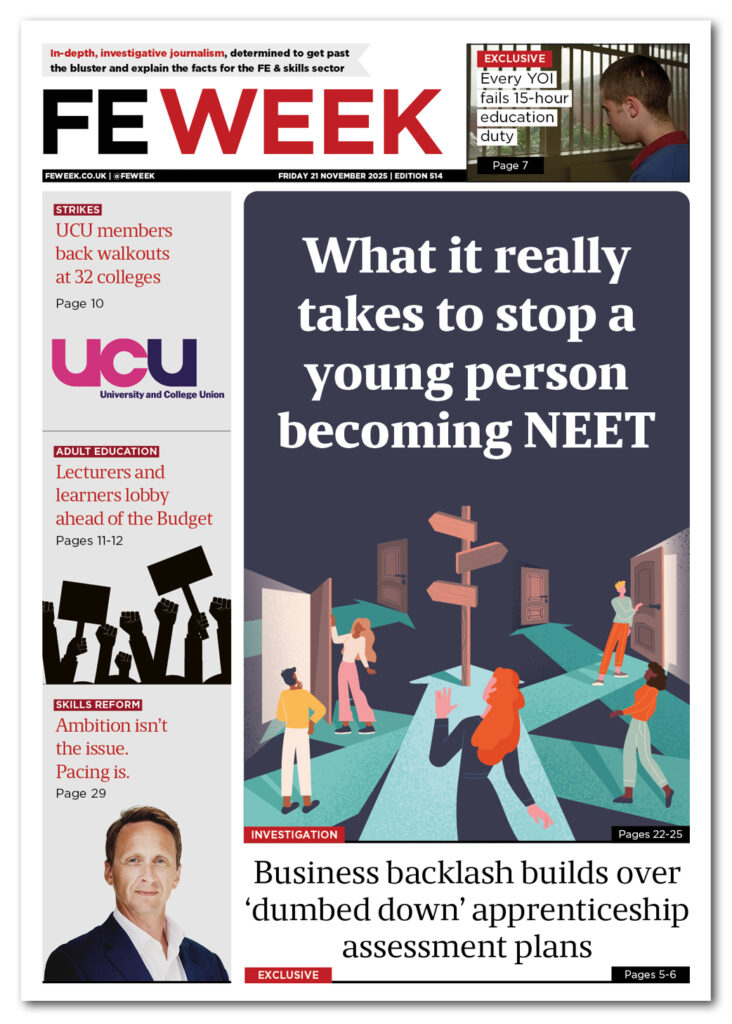
October’s ‘more with less’ post-16 education and skills white paper was the first opportunity to put Starmer’s words to the test. It was a framework to take us into the 2030s, built on the most pressing challenges of 2025: arresting the rise in NEETs (not in education, employment or training), diverting funding towards young people and prioritising reduced adult education spending – national and devolved – on economic growth sectors.
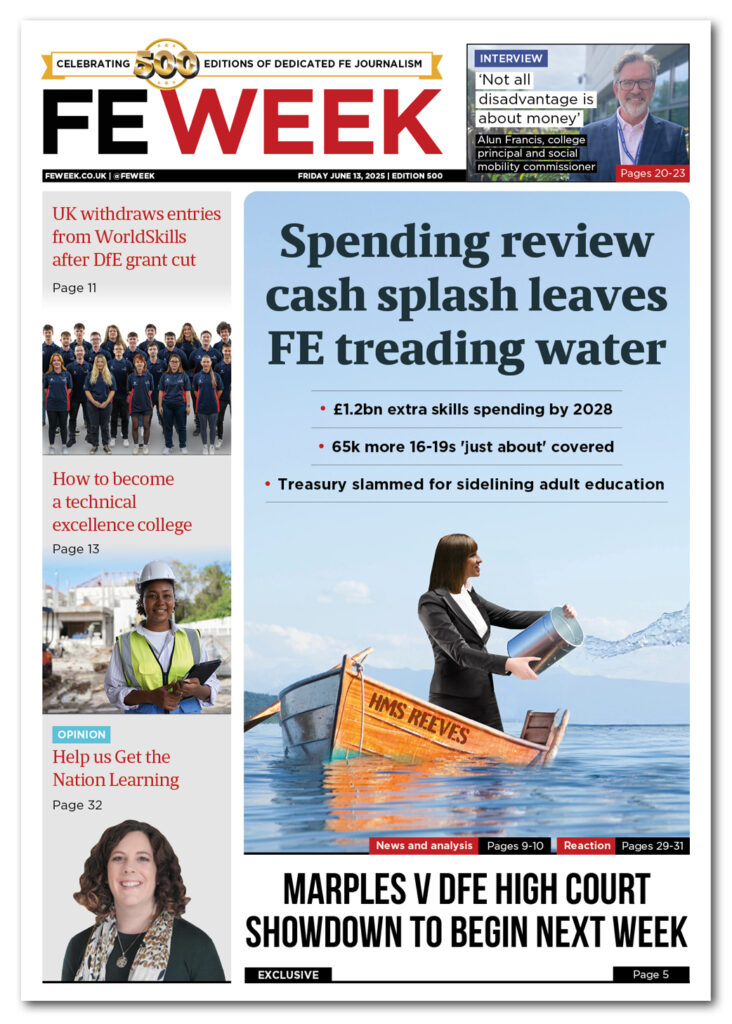
Demands for an adult education strategy were answered implicitly rather than explicitly. “Packages” worth £800m for construction and defence training at the same time as “regrettable” cuts to the general adult skills fund and tailored learning told us everything we needed to know. Adult education is rhetorically desirable, but fiscally expendable and will now come in “packages”.
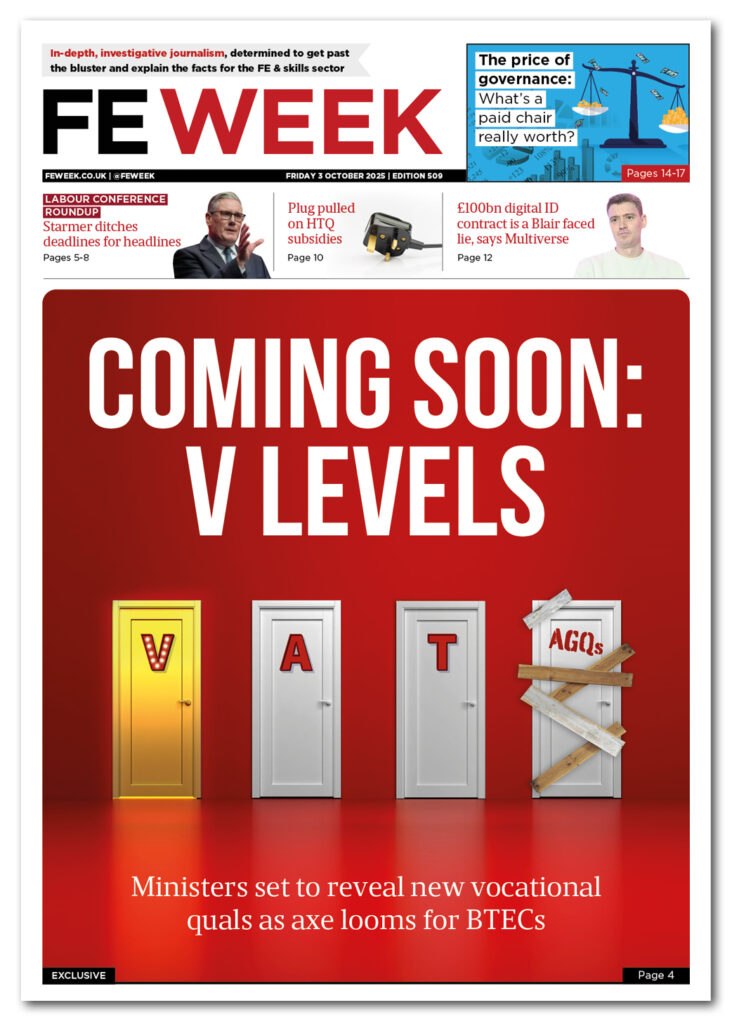
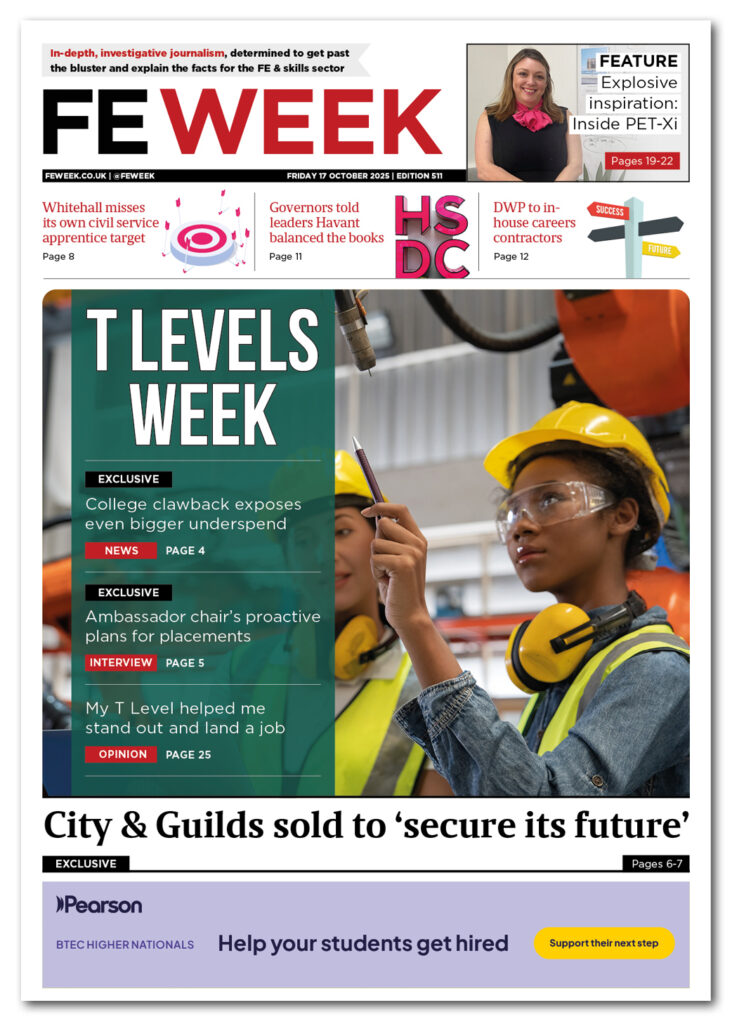
Meanwhile, young people have V Levels to look forward to. First revealed by FE Week and later confirmed in Becky Francis’s curriculum and assessment review, the latest iteration of vocational qualifications ends years of rows over the future of BTECs (RIP) and hopefully fills the applied general qualification-shaped gap left by T Levels.
Sector reaction to V Levels was fairly muted, with the standout exception of Trafford and Stockport College Group’s James Scott simultaneously giving the idea the V for victory and, well, the other V sign.
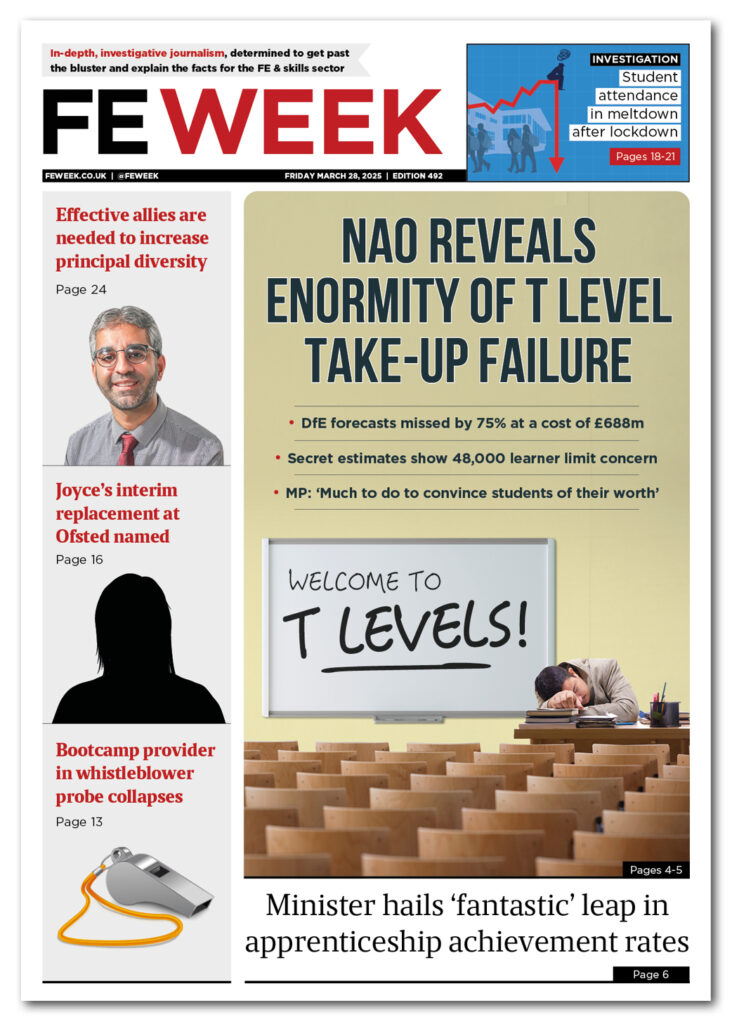
We can only hope that ministers and policymakers have learned the lessons of rushing through reforms at pace, remembering millions spent getting T Levels out the door only for some of them to end up on the scrapheap.
Moving house
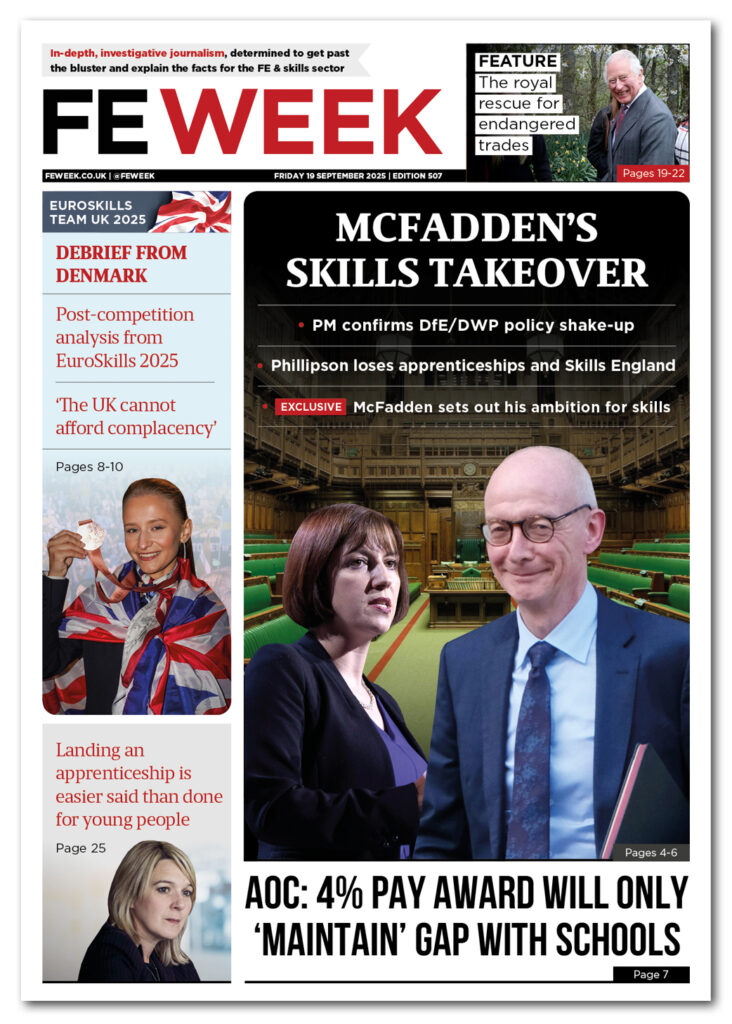
But who would have thought Angela Rayner’s resignation as deputy prime minister would have given the FE sector its biggest surprise of the year? In a move nobody saw coming, Starmer used the post-Rayner reshuffle to strip the Department for Education (DfE) of the skills policy brief and move it to the Department for Work and Pensions (DWP) under its new secretary of state, Pat McFadden.
We kept skills minister Jacqui Smith, who works on 16-19 and higher education at DfE and adult skills and apprenticeships at DWP.
But it took a few weeks to work out precisely what was moving, and confusion reigned even among MPs.
Skills England had barely established itself before being housed in its second department. The new executive agency had its first real scrap with the sector at the tail-end of this year over its handling of reforms to apprenticeship assessment and was forced to defend its plans against accusations it was “dumbing down” standards.
Funding costs
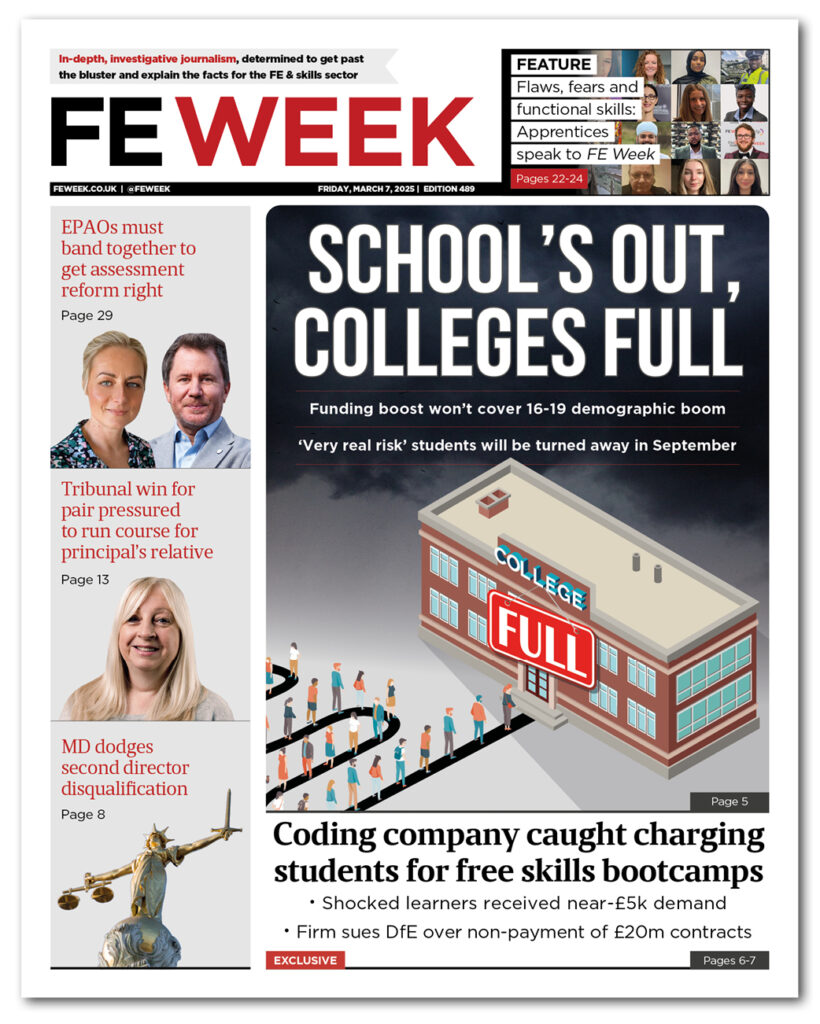
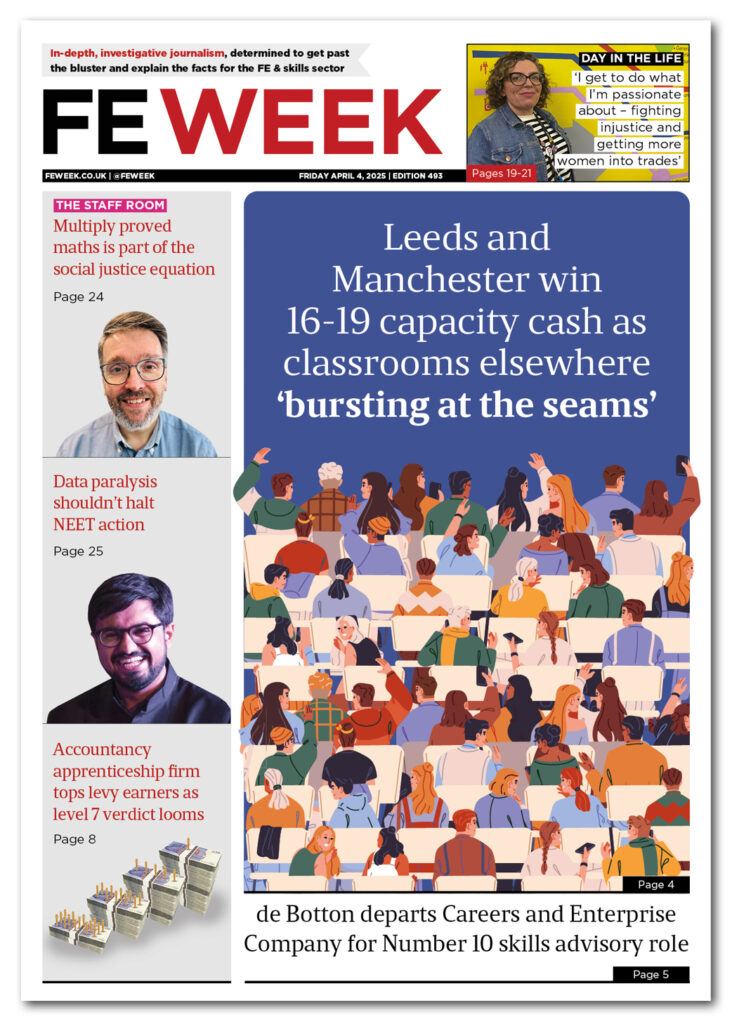
Funding was of course never far from the headlines. Throughout 2025, FE Week monitored adult skills spending in every devolved authority, and delved into the foreseeable shock that was the boom in 16-year-olds that caught the college system unprepared.
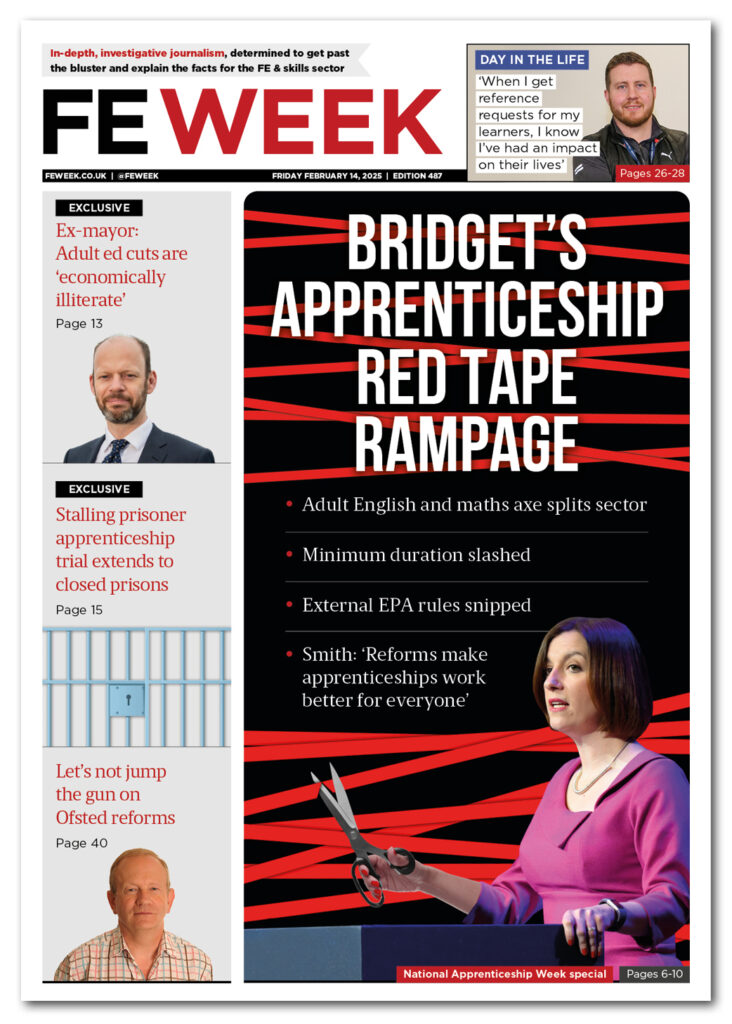
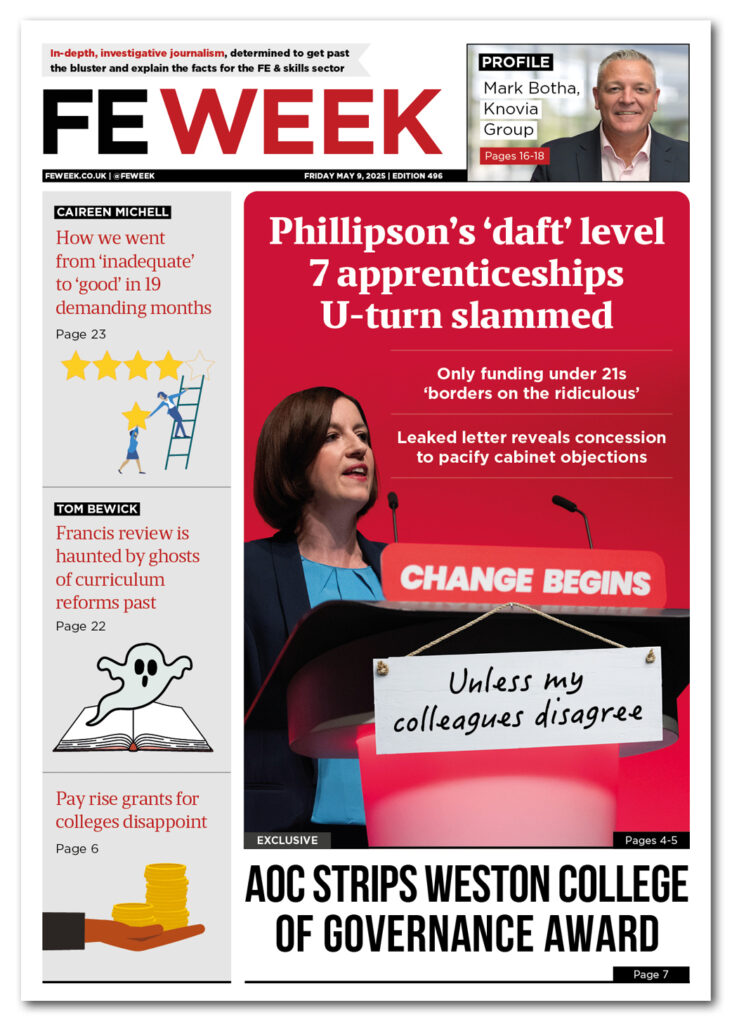
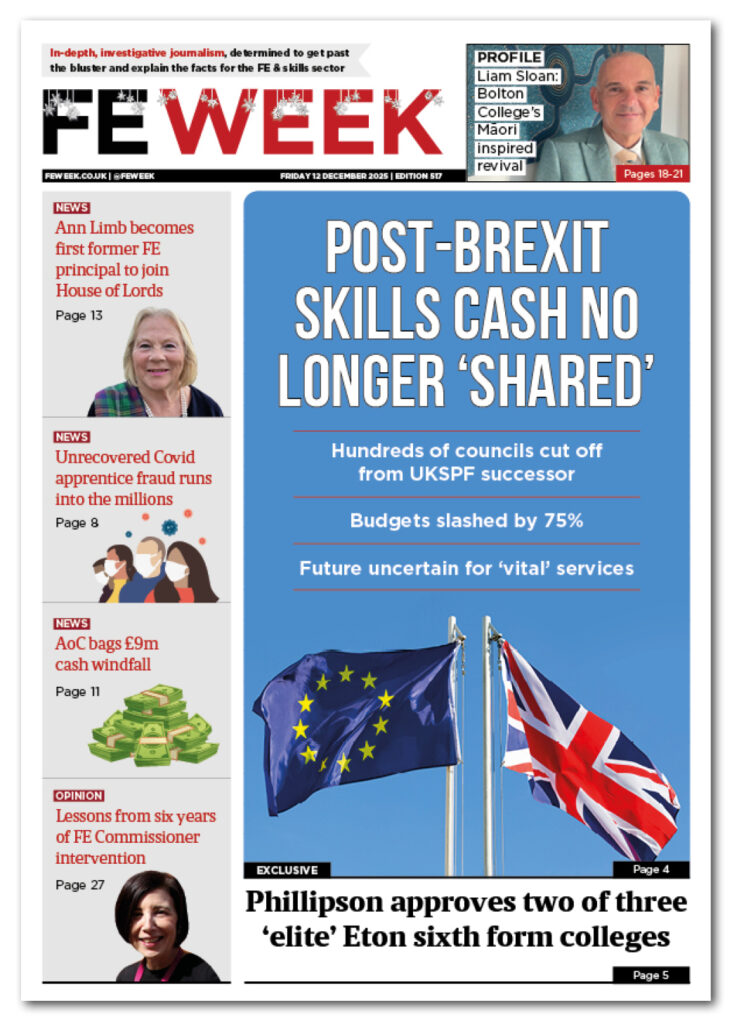
But it was level 7 apprenticeship funding that saw the biggest political fallout this year, splitting the sector between those sympathetic to the government’s aims of redistributing limited funds towards opportunities for young people and those fearing scrapping the programmes would cut off routes to the top professions. If it hadn’t been for members of the Cabinet reigning in Bridget Phillipson, as we exclusively revealed, the cuts would have been even deeper.
Our investigations also showed the long tail of DfE’s decision to give employers and training providers a long lead-in time before turning off the level 7 tap. Right now, providers and employers are scrambling for starts. There were 228 per cent more level 7 starts in July 2025 than July 2024 – and we don’t even have the data yet for the final months of this calendar year when the rush will intensify further.
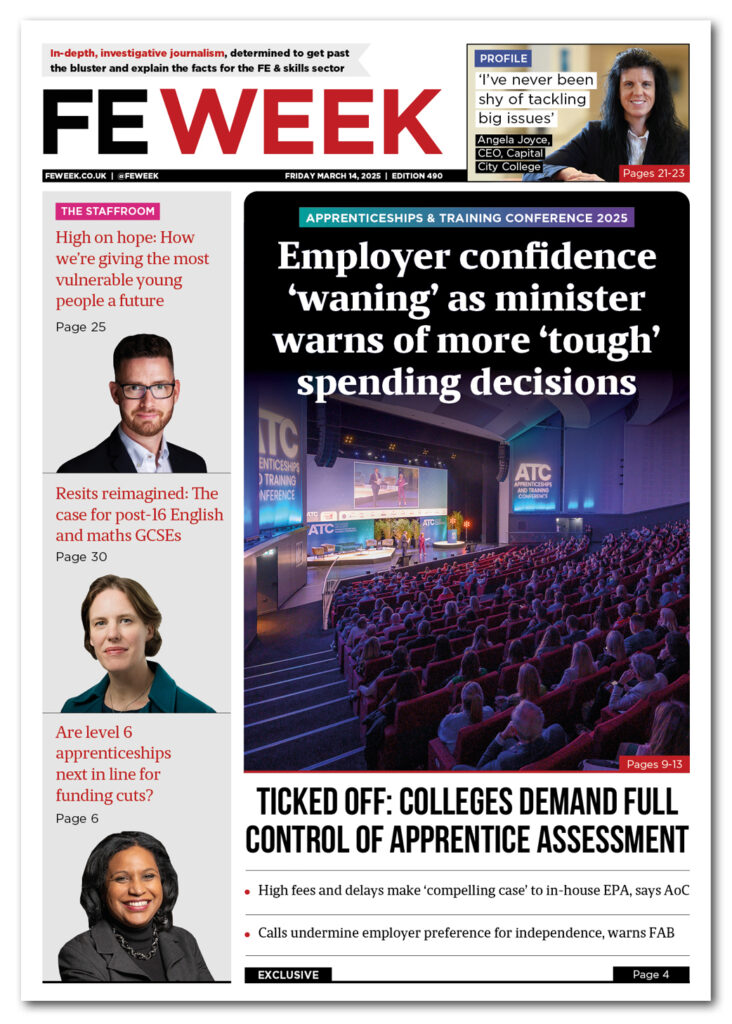
The cost is not just financial. The already stretched apprenticeship budget, with its fixed funding bands, demands from new programmes like foundation apprenticeships, growth and skills courses and a level 2 business admin standard reportedly somewhere in the pipeline, can only go so far before ministers are forced to make more tough decisions about higher level (and the most expensive) provision.
The cost will also be reputational. There is a sad inevitability about the hit recently improved achievement rates will likely take when newly minted level 7 apprentices (mostly senior leaders and accountants) drop out, don’t pass, or are found to be receiving poor quality training from providers that have grown too quickly.
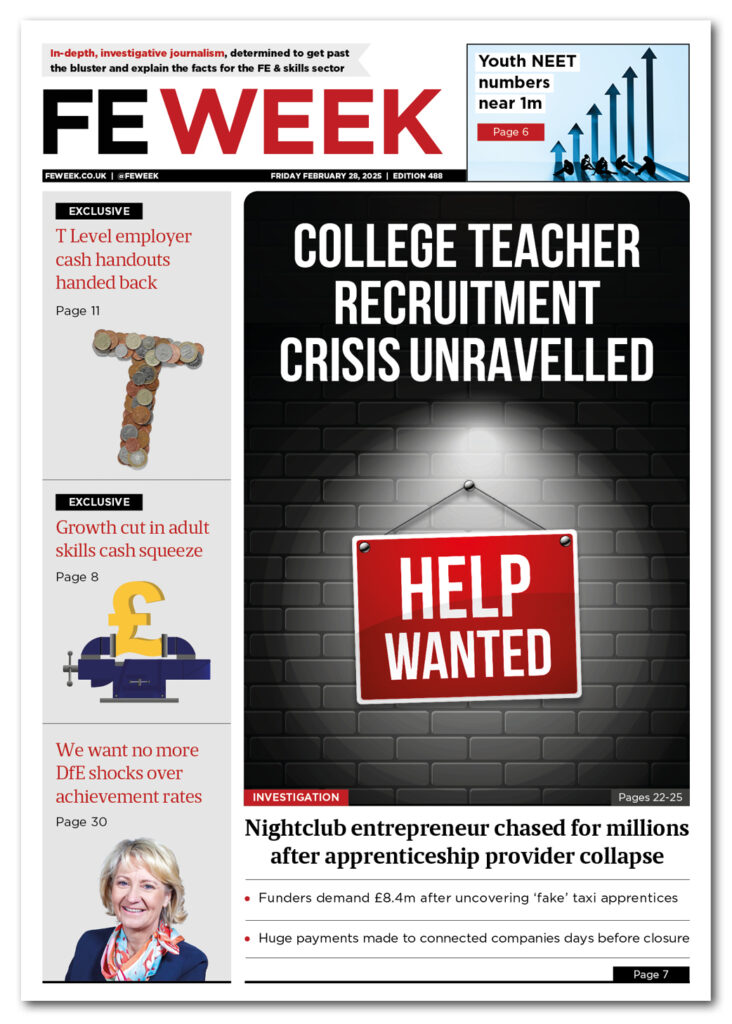
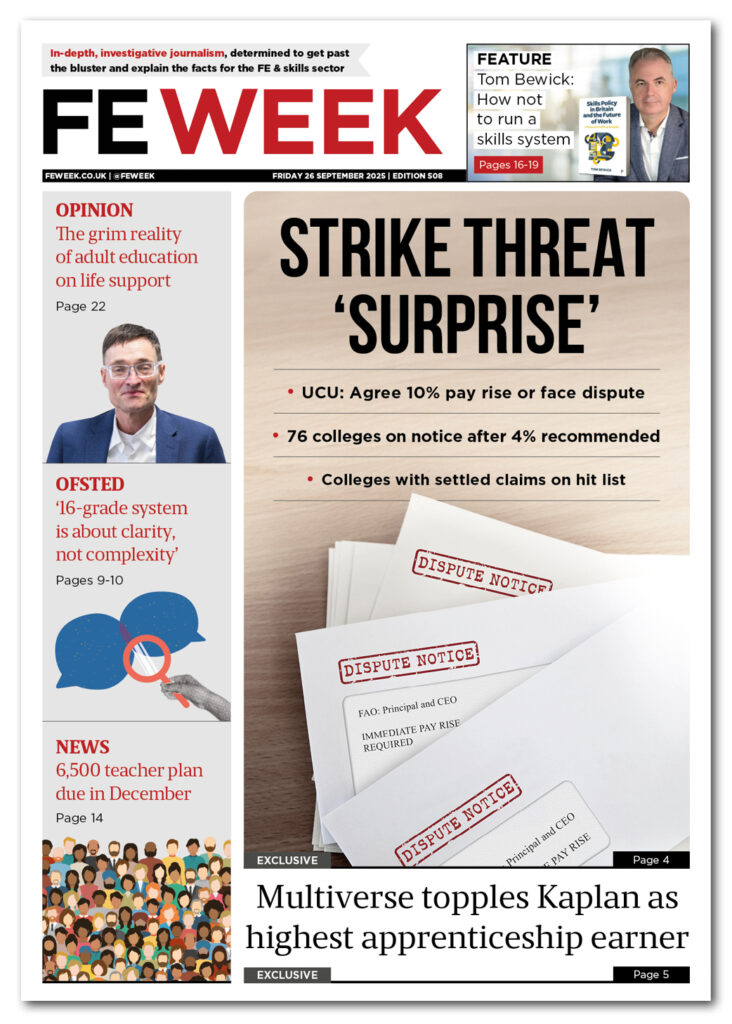
Some problems though are even closer to home. At the same time as being asked to solve the country’s workforce deficits, the FE sector is battling with its own. Our investigations into staffing shortages this year show a clear tonal shift from years of warnings to real-life consequences in the form of cancelled courses, record waiting lists and ongoing industrial disputes.
Spotlight returns to governance
While reform (and Reform) dominated headlines, college governance was one of 2025’s more uncomfortable subplots.
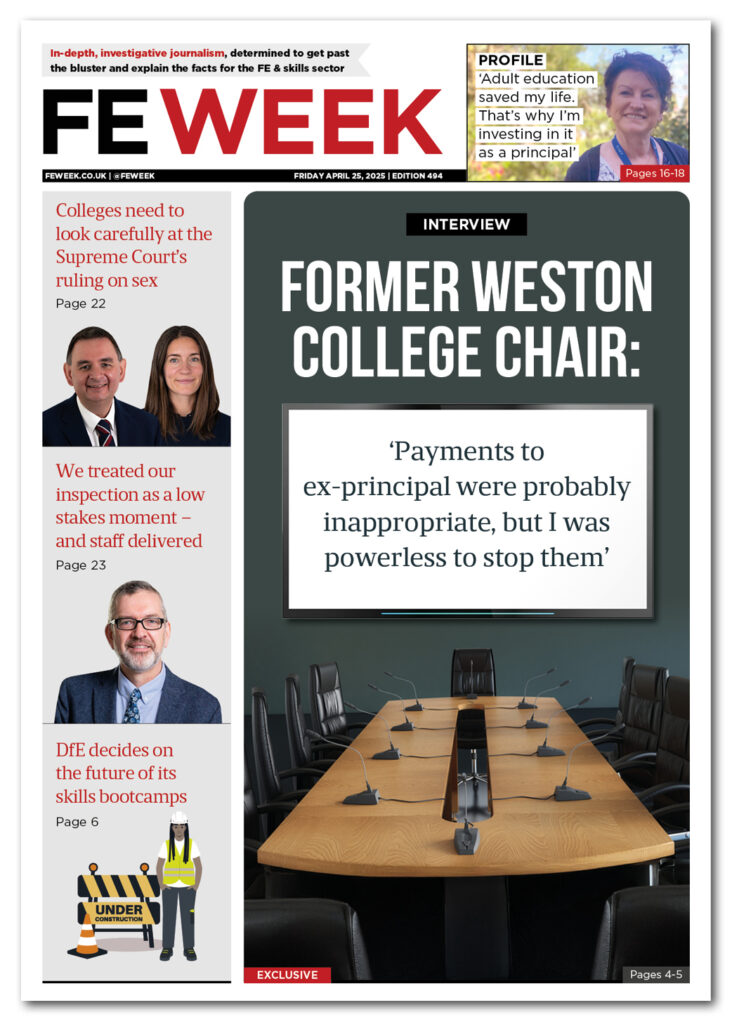
We saw Weston College emerge from scandal, but not before its former chair revealed he had felt powerless to stop millions in undeclared payments going to his still-knighted former principal.
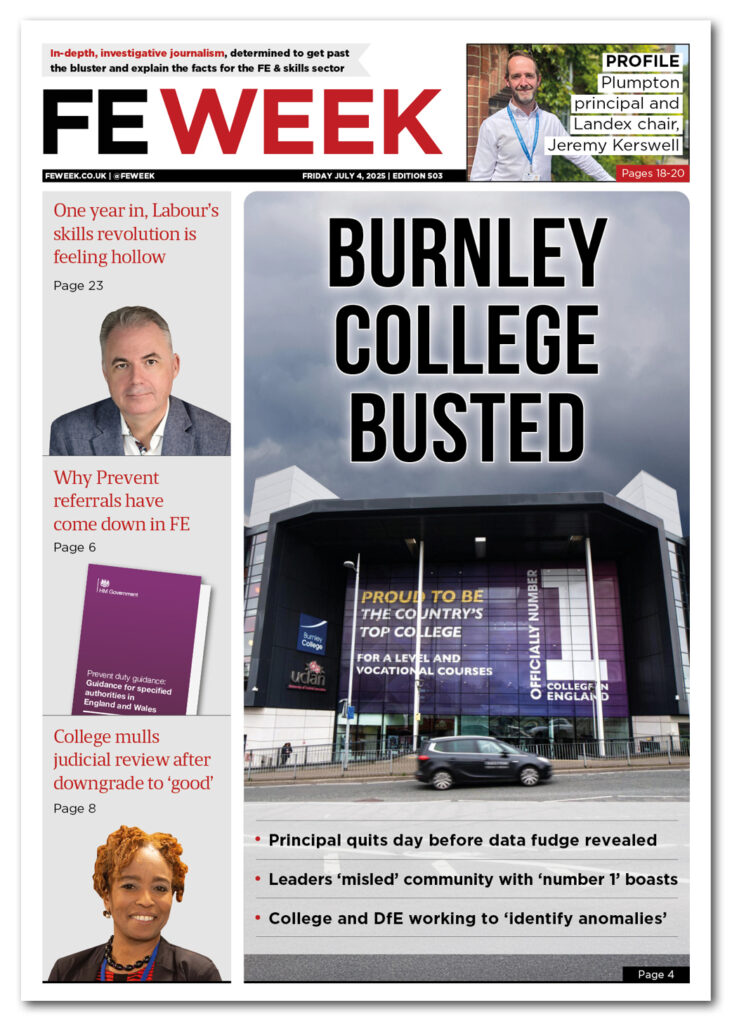
By summer, a new scandal had emerged. After months of mystery surrounding the disappearance of Burnley College’s principal, Karen Buchanan, Ofsted revealed the college had been inflating its 16-19 achievement rates, misleading students and the public by proudly but falsely declaring itself to be the “number one” college in the country.
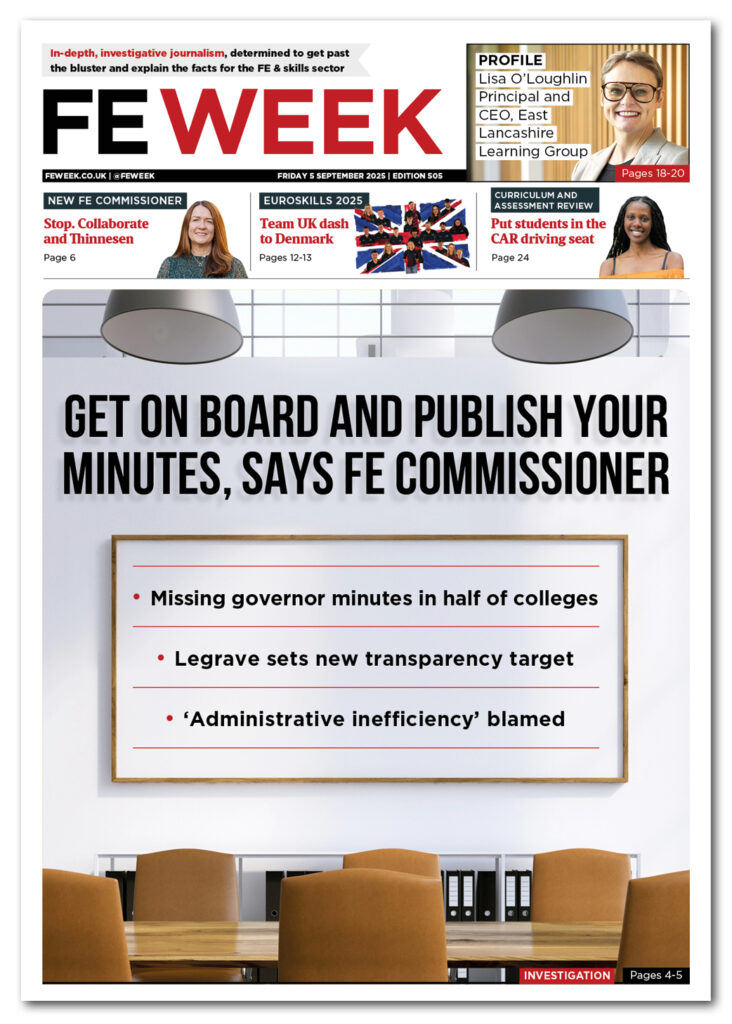
Governors were rightly slammed in both cases, triggering much-needed fresh debate about college governance models.
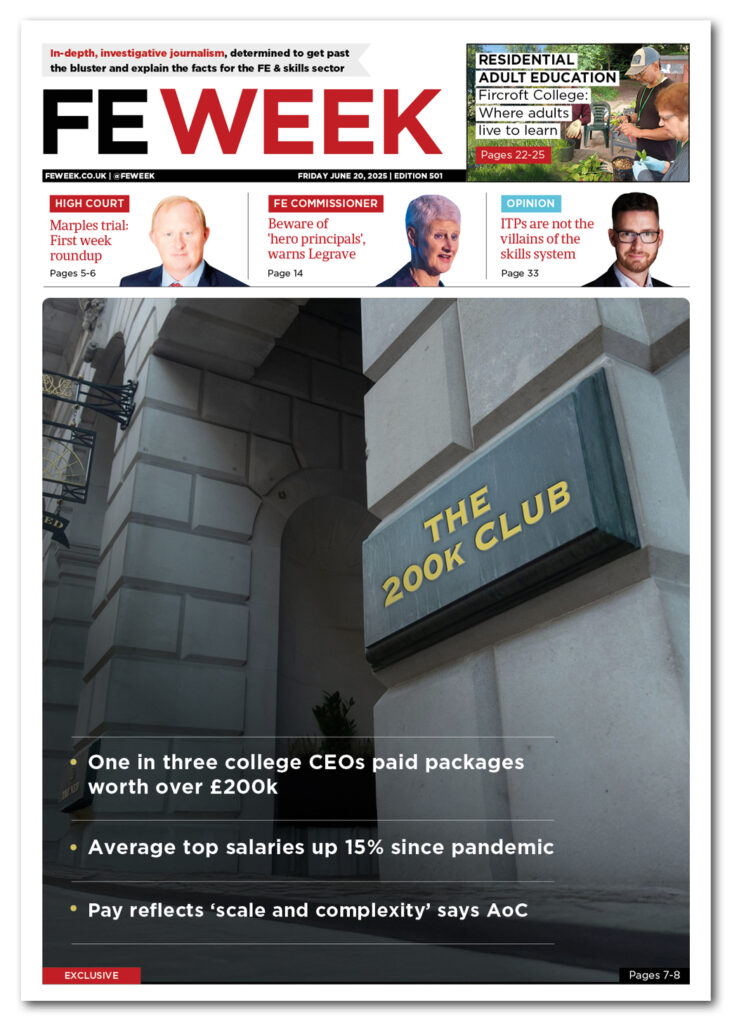
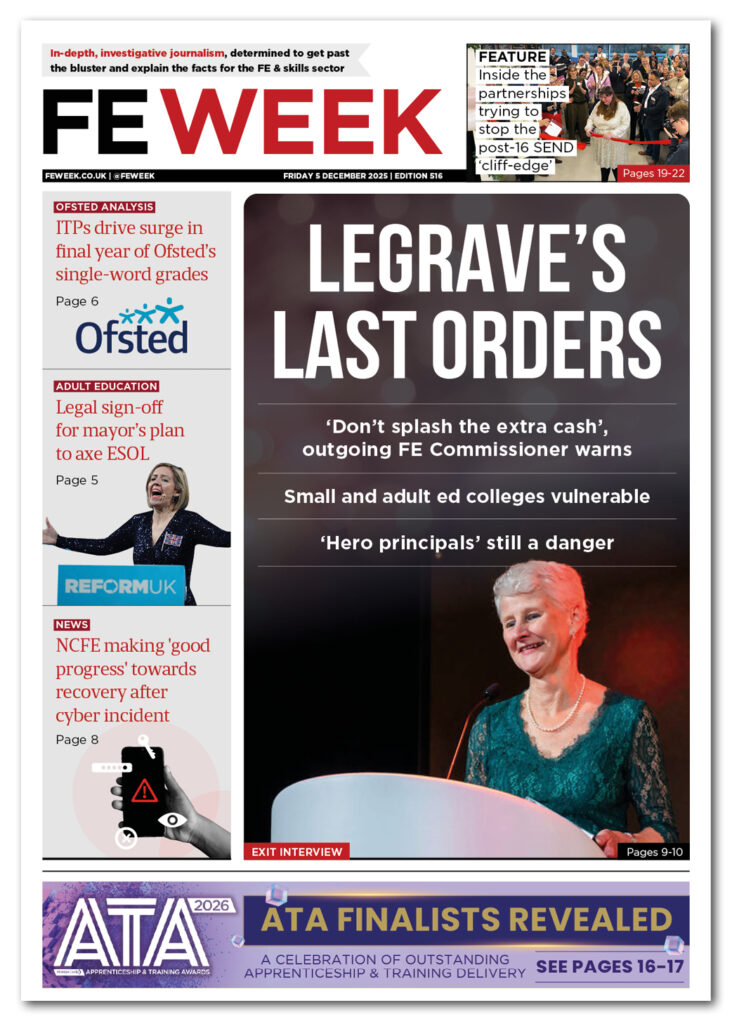
It probably wasn’t the final year as FE Commissioner that Shelagh Legrave was hoping for, but it did lead to her issuing some powerful parting advice to governors about challenging powerful leaders – beware of “hero principals.”
Lots to look forward to
We enter 2026 with FE defined by the (current) prime minister as central to the government’s economic mission, repositioned closer to the welfare system and with a white paper promising more change to come in every corner of the sector.
Major SEND reforms, V Levels, new level 2 pathways, beefed up local accountability rules, an adult essential skills review, higher technical “partnerships” with embattled universities, finally sight of the growth and skills levy, all alongside a new inspection regime, rising young student numbers, tougher public sanctions on misbehaving FE teachers and a major review into stubbornly high youth unemployment.
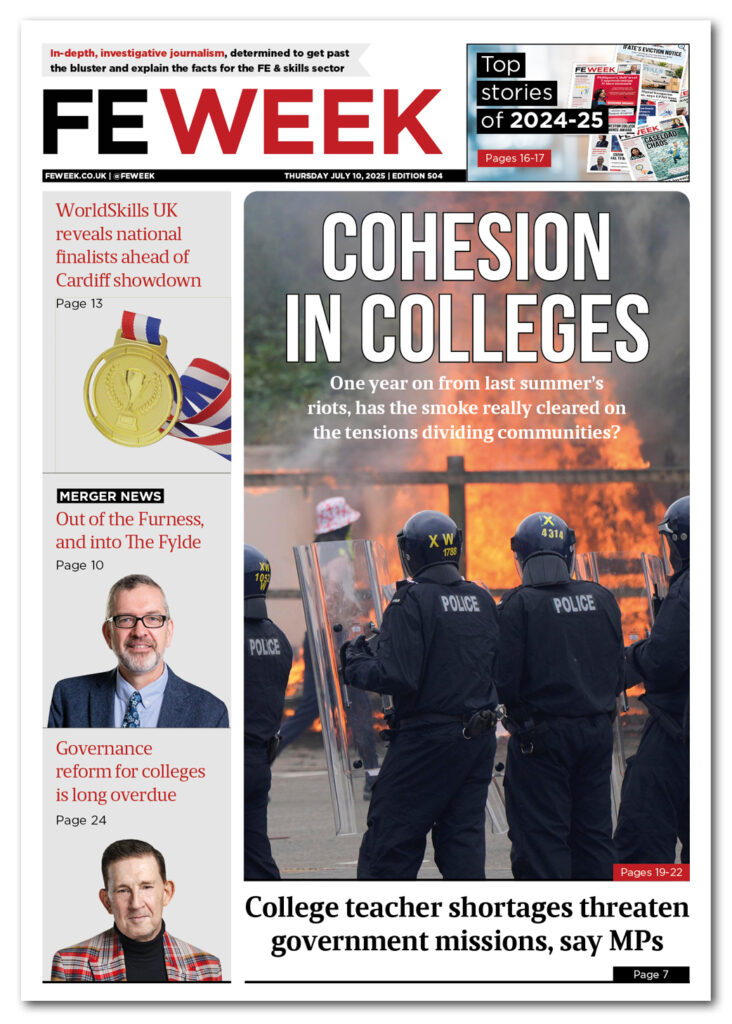
That is all to say nothing of the rising threat to educational integrity from the unregulated use of AI in FE classrooms and the front-line battles being fought right now by providers to keep communities together in the face of divisions stoked by the far right.
You have your work cut out for you, and so does FE Week.
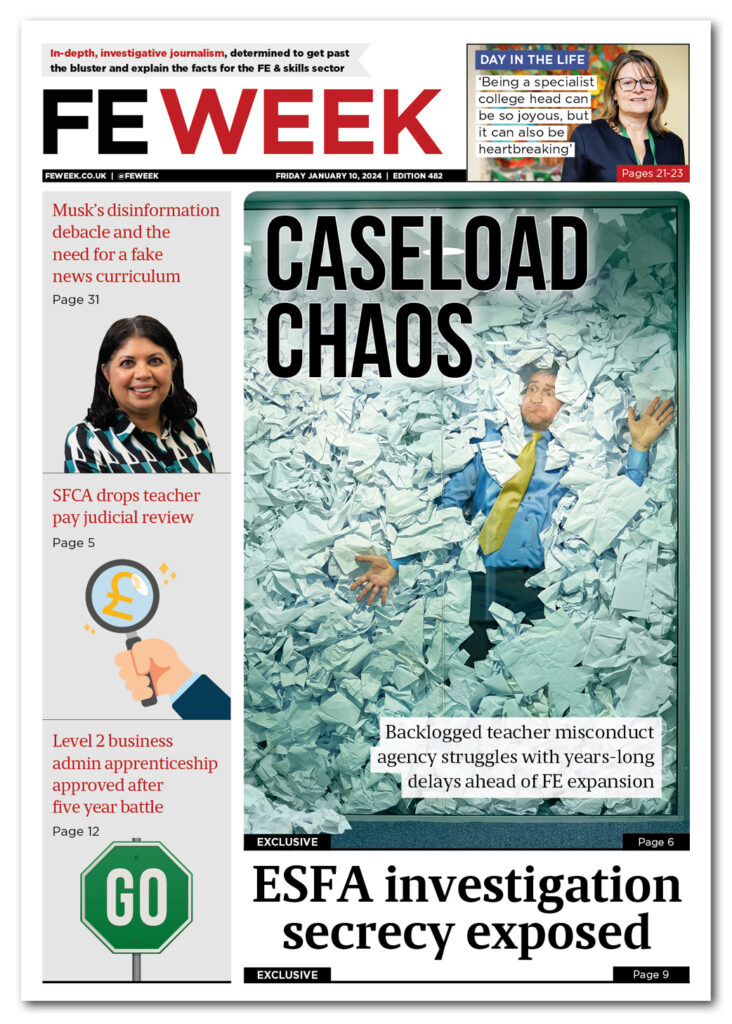
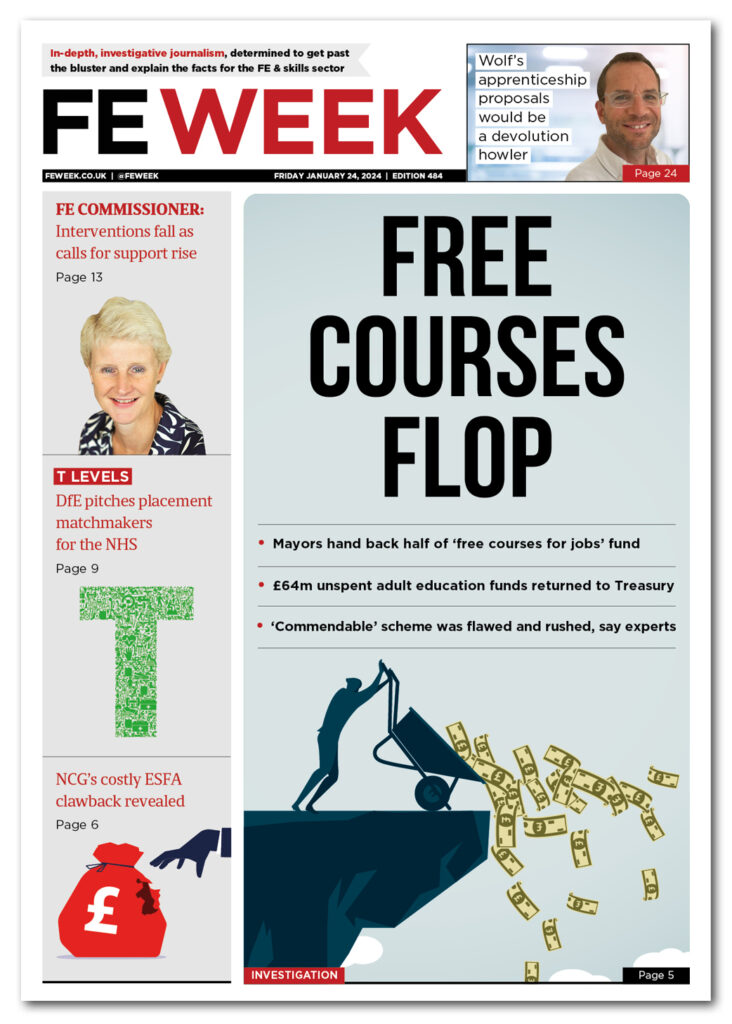
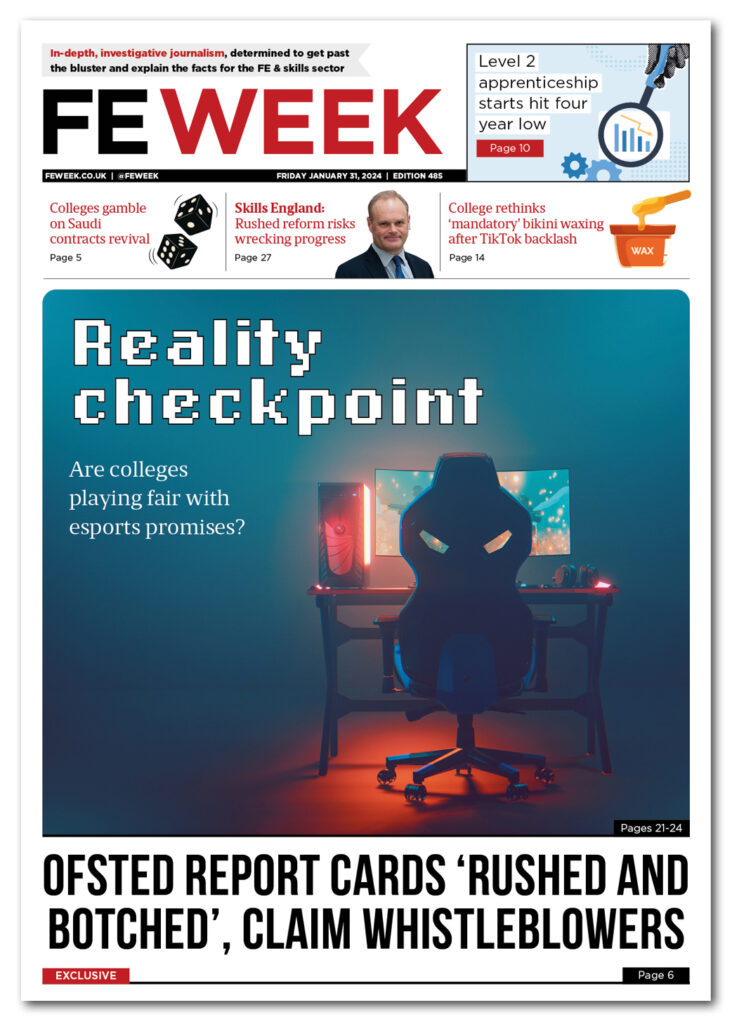
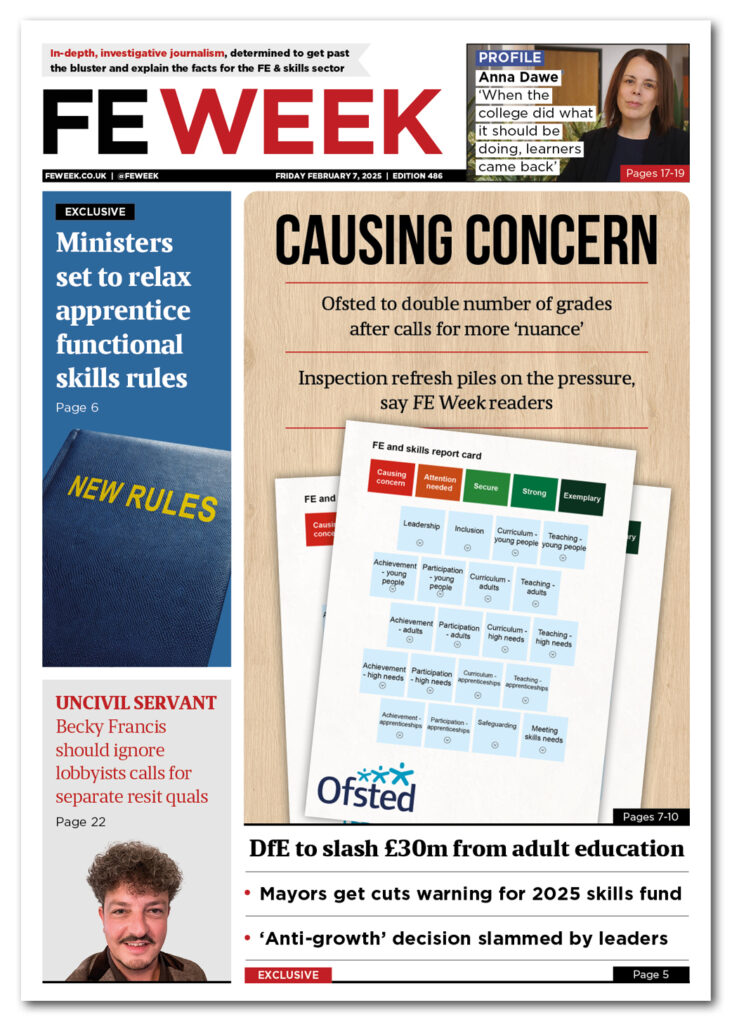
2025 in front pages