With the overall apprenticeship achievement rate now passing 60 per cent, FE Week has dived into the data to see what trends and patterns are hidden beneath the headlines…
ITPs jump 6.5 percentage points, but specialist colleges improved the most
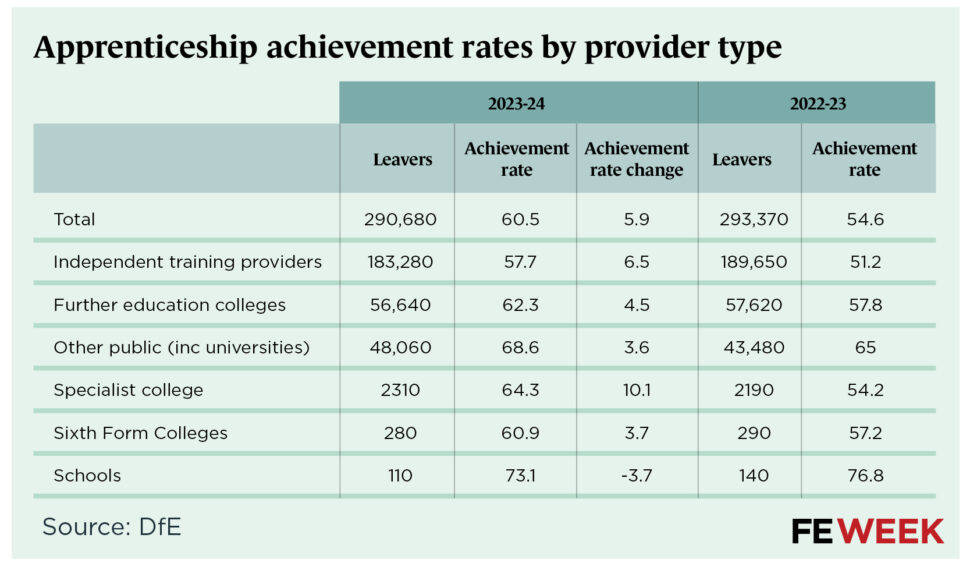
Apprenticeship achievement rates improved in each provider type except schools in academic year 2023-24.
Three in five (63 per cent) apprenticeships recorded as leavers were trained by independent training providers (ITPs). Achievement rates in ITPs increased to 57.7 per cent. While 2.8 percentage points shy of the overall average, this was a 6.5 percentage point increase from the year before.
Achievement rates in further education colleges also improved, but at a lower rate than ITPs, to 62.3 per cent up from 57.8 per cent. Around one in five leavers trained with a further education college in 2023-24.
The largest achievement rate rise was in specialist colleges which increased by 10.1 percentage points, from 54.2 per cent in 2022-23 to 64.3 per cent in 2023-24.
Officials categorise universities which deliver degree-level apprenticeships in an “other” category, which also includes local authorities. Achievement rates for this group improved from 65 per cent to 68.6 per cent with around 16 per cent of the cohort.
Large providers (mostly) improve
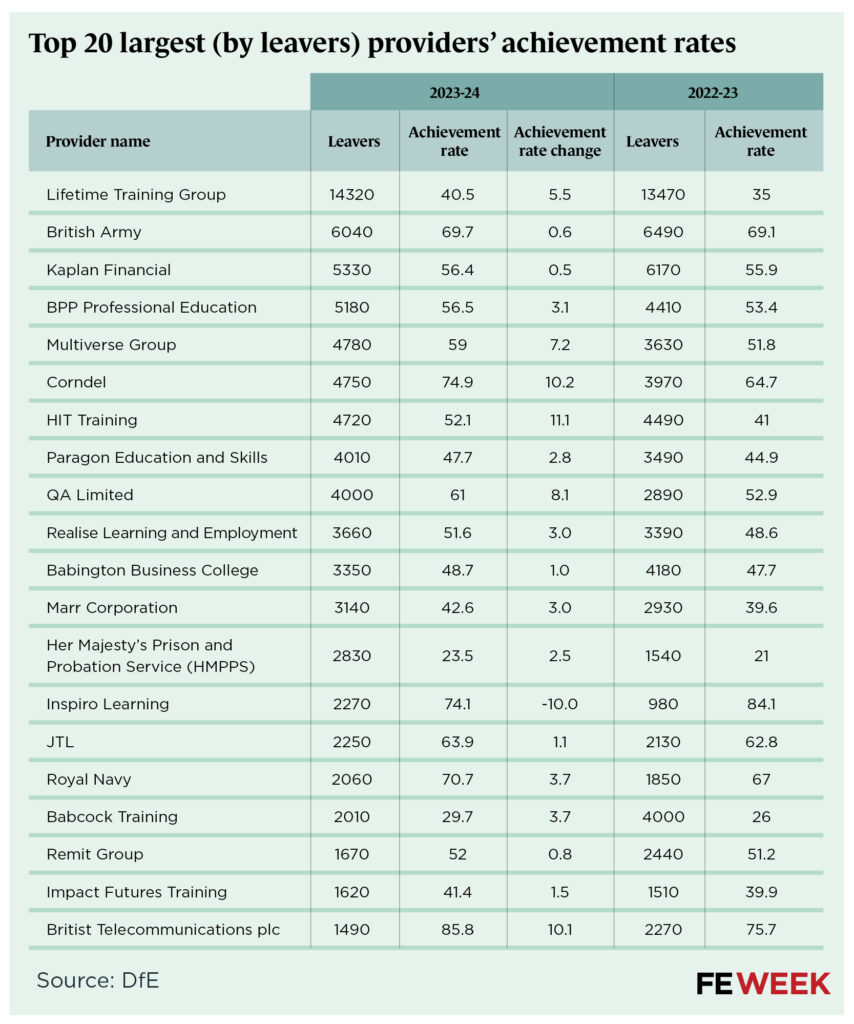
With over 14,000 leavers recorded for 2023-24, England’s largest training provider scored a 40.5 per cent achievement rate, up from 35 per cent the previous year.
Lifetime Training delivered 47 apprenticeship standards in sectors including care, hospitality and retail. It improved its achievement rate after a 10-percentage point dip between 2021-22 and 2022-23.
Notable improvements among large-volume training providers also include Multiverse, 59 per cent up from 51.8 per cent and Corndel, 74.9 per cent up from 64.7 per cent.
Among the providers with the highest achievement rates for 2023-24 was League Football Education. Its 600 leavers for that year were all on the level 3 sporting excellence professional standard and scored an achievement rate of 95.3 per cent.
However, it wasn’t good news across the board. Ixion Holdings clocked up an extra 600 apprentice leavers in 2023-24 but saw its achievement rate decline from 50.4 per cent to 21.8 per cent.
For colleges, Bridgwater and Taunton had the highest number of leavers (1,250) across 102 apprenticeship standards and improved its achievement rate from 64.3 per cent to 70.2 per cent.
Level 6 reaches achievement rate target
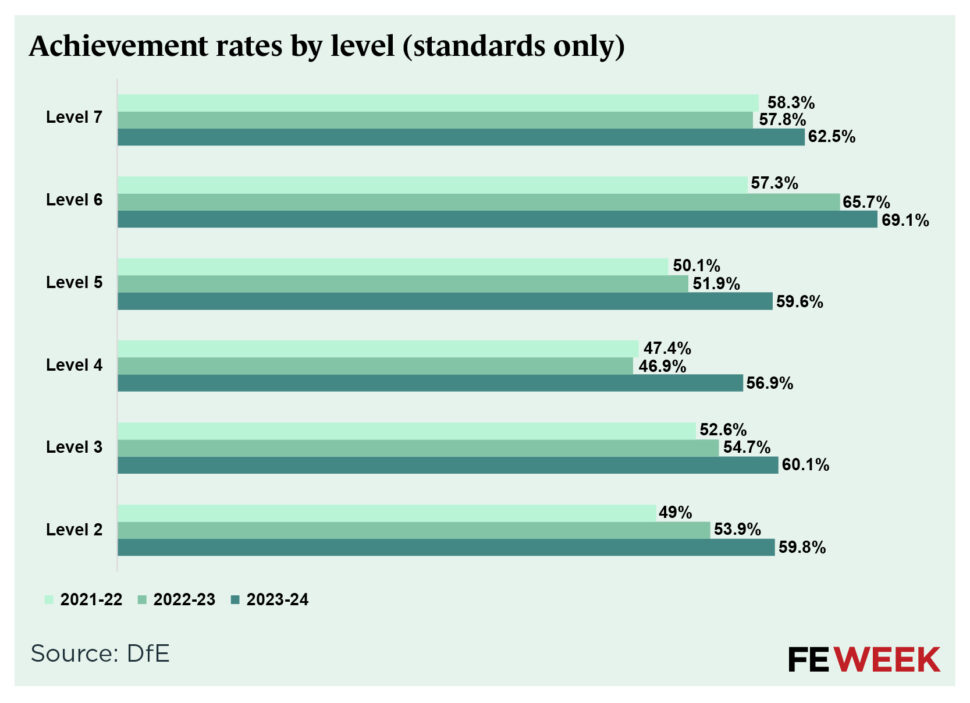
Level 6 apprenticeships have surpassed the government’s 67 per cent apprenticeship achievement rate target. They were already the highest performing apprenticeships, but saw their achievement rate increase to 69.1 per cent in 2023-24, up from 65.7 per cent in 2022-23.
Apprenticeships at level 4 saw the largest achievement increase, jumping 10 percentage points from 46.9 per cent to 56.9 per cent.
Level 7 apprenticeships are the next closest group to the target, now standing at 62.5 per cent.
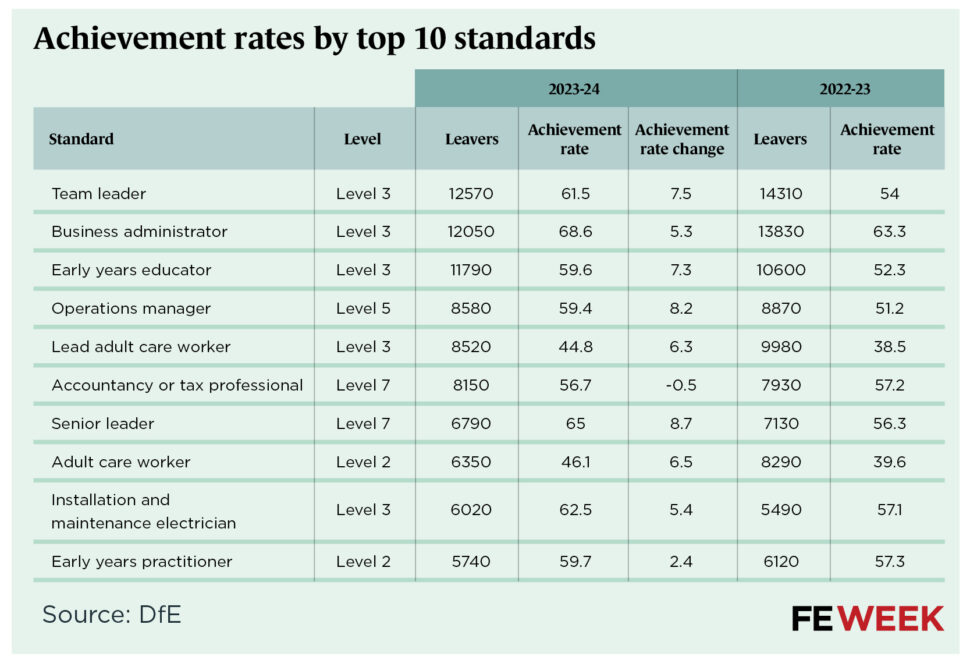
Each of the top 10 most popular apprenticeships saw their achievement rates increase, except the level 7 accountancy and tax professional standard.
The level 3 team leader, which had the highest number of leavers in 2023-24 (12,570) had an achievement rate of 61.5 per cent, up from 54 per cent the year before.
Meanwhile the level 3 business administrator became the only top 10 apprenticeship to have surpassed the government’s 67 per cent target, with an achievement rate in 2023-24 of 68.6 per cent.
The lowest performing standards in the top 10 were the adult care worker and lead adult care worker. The level 2 adult care worker standard improved from 39.6 per cent to 46.1 per cent. For the level 3 lead adult care worker, the rate increased from 38.5 per cent to 44.8 per cent.
LLDD achievement up, but so is the gap
The achievement rate gap between learners with learning difficulties and disabilities (LLDD) increased slightly to 4.5 percentage points in 2023-24 compared to 4.3 in 2022-23.
Data shows 14 per cent of apprentice leavers in 2023-24 were LLDD, a similar proportion to the year before. The achievement rate for those apprentices was 56.7 per cent, up from 51 per cent the year before.
Overall ethnicity achievement gap falls
New achievement rate data shows the gap between white and ethnic minority apprentices has narrowed to its lowest level in three years.
There was a 5.3 percentage point gap in favour of white apprentices in 2023-24, down from 6.8 the year before. The combined achievement rate for ethnic minorities (excluding white minorities) was 56 per cent, compared to 61.3 per cent for white apprentices.
Data shows the gap has narrowed across each ethnicity has narrowed, though the largest gaps remain between white (61.3 per cent) and Black / African / Caribbean / Black British (53.9 per cent). This 7.4 percentage point gap for 2023-24 was 10.2 per cent in 2022-23.
The smallest gap, 3.3 percentage points, was between white and Asian / Asian British apprentices (57.2 per cent).
Achievement gap between most and least deprived narrows overall
The overall achievement gap between apprentices from the most and least deprived postcodes continues to narrow slowly.
Officials use the index of multiple deprivation (IMD) to classify the home areas of apprentices into five quintiles of relative deprivation.
In 2023-24, the achievement rate for apprentices from the most deprived areas was 56 per cent – an improvement from 49.5 per cent the year before. For those from the least deprived, the achievement rate increased to 63.9 per cent from 58.4 per cent.
This means there was a 7.9 percentage point gap in achievement rates, down from 8.9 in 2022-23 and 9.8 in 2021-22.
However for 16- to- 18-year-olds, the gap grew very slightly from 8.4 percentage points in 2022-23 to 8.5 in 2023-24.






If rates were zero or 100%, there would be no gaps! The question is whether low outliers improving is increasing overall achievement or whether overall achievement increasing means there is less room for wide gaps, so they appear narrower…
The real issues aren’t really in the gaps, it’s in the size distribution between the starting or leaving cohorts. If you cross cut the disadvantage quintile or ethnicity data with level of study, you’ll see wide participation gaps. That’s where your achievement gaps have their roots.
For people in the lowest quintile of deprivation, disruption in life can mean they have to overcome more barriers. It’s harder to achieve. Lower entry level jobs are also inherently less stable, ‘dropping out’ is often not in the apprentices gift to control.
Of participation gaps & achievement gaps, which is the bigger limitation on peoples lives?
And please dump the phrase ‘drop out’. People are very quick to judge and finger pointy these days, often based on overly simplistic information.