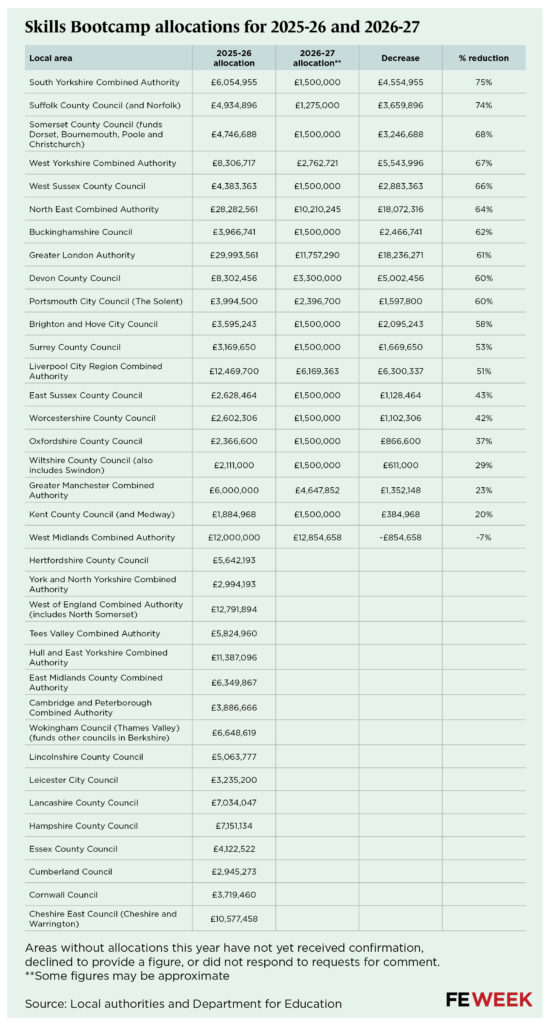
Training provider to close after 40 years following damning Ofsted report

A training provider is planning to close after an ‘inadequate’ Ofsted judgment due to “systemic weaknesses” in safeguarding and “distracted” management.

An inspection of Resources, based in the north east of England, found apprentices study “poorly planned curriculums” and “too few” adult learners find work after gaining a qualification.

Ofsted uncovered “systemic weaknesses” in safeguarding, including inappropriate responses to “serious concerns”, staff ignoring messages about training, and records that were “incomplete, disorganised and difficult to access”.

It also found that attendance in construction apprenticeships was “too low”, with poor coordination and understanding of off-the-job requirements, and a lack of engagement with businesses about their employees’ progress.

The company, which has operated for more than 40 years, is now dismantling its five rented premises across the north east, including Jarrow, Sunderland and Newcastle, and at least 38 staff are understood to be facing redundancy by October this year.

Contracts expected to expire or be terminated include Department for Education apprenticeship training, adult education through the North East Combined Authority, and a programme for unemployed young people subcontracted from Barnado’s.

At the time of the inspection, Resources had about 60 adult learners on courses such as security, warehousing and hair and beauty, and 100 apprentices in hair, beauty and construction.

Leaders failed to improve the quality of training because they were “distracted” by “prolonged operational change and financial instability”, Ofsted said.

The report adds: “Many lack a secure grasp of operational issues such as learner numbers, achievement rates, and line management responsibilities.”

But managing director Barry Stidolph hit back at the report, which he said was “absolutely nowhere near fair” as it failed to reflect the “good stuff” or quality improvement plans the company has in place.

He added: “What annoys me in the report is it’s written in a way that’s damning, rather than fair – it’s not a fair reflection of the 40 years’ work we’ve done – we just want some accuracy and balance.

“Are young people in the area going to be better off because we are now closed? I don’t think the answer is yes.”

Stidolph, who claimed the inspection required him to work 80 extra hours, said his complaints about the report were rejected by Ofsted, which he claimed were “basically marking their own homework”.

When approached about the managing director’s concerns, an Ofsted spokesperson said they do not comment on individual cases.

The report downgraded Resources from ‘good’ and rated the company’s quality of education, leadership and apprenticeships as ‘inadequate’.

Personal development and adult learning were graded ‘requires improvement’ while behaviours and attitudes were graded ‘good’.

Key concerns in the company’s performance included just over half of apprentices achieving and declining achievement rates in English.

Management was taking “appropriate action” to improve apprenticeship completion, but improvement plans in other areas were “yet to be implemented”.

Inspectors noted that curriculums were not “ambitious” with painting and decorating apprentices lacking the opportunity to practise key skills such as wallpaper hanging techniques and beauty therapy learners on “insufficiently challenging” level 1 courses.

Apprentices were not set targets that would help them develop knowledge and skills, with tutors setting tasks such as “complete log” or “start collecting evidence”.

Careers guidance was also ineffective, inspectors suggested.

Both adults and apprentices study in environments that are “often poor”, due to a lack of privacy in the beauty therapy facilities and unclean Construction areas.

However, inspectors praised an “inclusive and supportive” culture at the centres, with learners building their confidence and “effective” teaching on short adult study programmes.

Saqib Bhatti appointed as Conservative shadow education minister

Saqib Bhatti has pledged to “hold Labour to account for their damaging policies and empty promises” following his appointment as a shadow education minister.

The MP for Meriden and Solihull East took on the role last month in the Conservatives’ frontbench reshuffle.

He replaced Neil O’Brien, who was promoted to the shadow cabinet as shadow minister for policy renewal and development.

Laura Trott, MP for Sevenoaks in Kent, remained in her post as shadow education secretary.

Bhatti entered Parliament in 2019 as MP for Meriden. He was a private parliamentary secretary (PPS) in the Department for International Trade from 2020 to July 2022 and was the parliamentary under-secretary of state for technology and the digital economy between November 2023 to July 2024.

He was also the Conservative Party’s vice chair for business and was elected to the foreign affair select committee in 2022. Over the past year he has held shadow ministerial roles in the health, science, and culture departments.

Prior to his political career, Bhatti was a chartered accountant and president of the Greater Birmingham Chambers of Commerce.

Following his appointment to the shadow education ministerial brief he said: “I look forward to working with the shadow secretary of state, Laura Trott MP to hold Labour to account for their damaging policies and empty promises.”

Bhatti told FE Week: “I am delighted to have been appointed shadow minister of state for education because education is the greatest enabler of social mobility and opportunity, and post-16 education and FE colleges are core to this mission.

“I have always been a great believer in further education, which is vital for both personal and professional growth. It provides individuals with the skills and knowledge needed to adapt to a changing job market, increase career opportunities, and boost earning potential. This is something I have seen first-hand.”

Bhatti was born in Walsall and attended King Edwards VI School for boys before reading law at the London School of Economics. He also holds an honorary doctorate from Aston University in business administration and was awarded MBE in 2020 for services to diversity and inclusion in business communities.

The MP was on the national board for Vote Leave in the build-up to Brexit, during which time he “also launched ‘Muslims for Britain’ and he is credited with delivering the Leave vote in Birmingham”, according to his website. 

Bhatti was also deputy chair for the Andy Street 2020 mayoral campaign.

He said Labour’s planned removal of funding for level 7 apprenticeships for over 22-year-olds “hurts social mobility and reduces opportunity.”

Bhatti added: “I am also concerned about the impact of tax rises and inconsistent funding from government. 

“FE institutions need consistency so they can plan, and any further tax rises (especially unfunded ones) could be deeply damaging to the sector and would be contradictory to the government’s growth agenda.”

When is a pass not a pass? When the system says so 

Imagine in any other time in life where you graft, battle, sweat, cry and manage to get yourself ready to do an incredibly challenging thing, to then be told that your ‘pass’ isn’t worth anything because it’s not the right number. This, as we all know, is what will be happening to thousands of students across the land on GCSE results day. 

Then the yearly battle occurs of the FE sector picking up the pieces and having to support students through the challenge of mitigating disbelief, disappointment and at times diminished self-worth. 

When posing the question of when is a pass not a pass, a flurry of confusing and often rather contradictory ideas come to mind. A grade 1-3, whilst technically still a pass, will always be sidelined in data meetings and result day headlines. A grade 4, known as a ‘good pass’ – an arbitrary statement in itself – is the benchmark. Whilst we agree that a benchmark is needed, we have to ask ourselves whether we are essentially refusing to acknowledge the thoughtful work that requires our pupils to achieve a grade 1 to 3 and below.  

The concept of ‘failure’ does not seem to be given the thorough consideration it deserves in relation to the effect it has on our young people. As educators, we get inundated by the notion that high expectations only means one thing: a 4 and above at GCSE.  

But what if this year we switched the narrative and for all students consider that a pass is exactly that, a pass? The constant monitoring and target-setting is making education feel finite, when in fact it’s arguably one of the most infinite things we have. 

We’re applying finite rules upon an infinite game

In his book “Finite and Infinite Games” James Carse, American academic and religious scholar defines a finite game as being “defined as known players, fixed rules, and an agreed-upon objective”, whereas an infinite game is “known and unknown players, the rules are changeable, and the objective is not to win—the objective is to keep playing, keep perpetuating the game”. 

In our target-driven education system, we are applying finite rules upon an infinite game. A pass at grades 1-3 should not equate the end of an academic journey, especially considering students achieving a grade 1-3 have often done so against odds and challenges that have been placed upon them during their entire academic journey. 

We should not and cannot ignore that for many, time in education is not as linear as our system would like and the desired result may manifest later.

Something the English and Maths Coalition is striving to alter is the perception that the problem is the exam itself. For many students, it’s not the case that a particular GCSE exam isn’t the right exam for them, but that they’re just not at the right time to take it yet.  Take reading development, for instance. If you’re still developing your reading fluency, automaticity and even needing additional support with phonics, then you just weren’t ready for the exam yet.  It doesn’t mean that you never will be. 

Seventy-six per cent of our young people now achieve level 2 English and maths by age 19 which means we should praise the FE sector for transforming lives and allowing students to reach that level 2 benchmark at the time when they’re ready.  With strong, consistent teaching and learning, which doesn’t just focus on exam prep but a re-engagement in English Language learning, young learners are improving their grades. 

Often, FE colleges get ignored when reporting on KS4 success. Rather than creating a system where mainstream secondary schools can learn from them, the role of FE becomes an addition that feels elusive and hidden. This must change. It is time to have a more holistic view of education, one that chooses to centre on the potential trajectory of the child, rather than one arbitrary destination.  

Forget the gloom, T Levels are turning a corner

Baker Dearing and the University Technical College network are really pleased more students have completed their T Levels this year, and that the pass rate has surpassed 90 per cent.

This shows how T Levels, which rely on solid employer partnerships and a high bar for technical provision, have matured and are working well across the school and college system.

Industry placements are giving young people the experience of the workplace that helps them move seamlessly and confidently into apprenticeships and careers.

The course content and examinations for T Levels, while exacting, means students have the skills that industry needs and are prepared for the high expectations of work.

All of which means more students can progress onto fantastic apprenticeship and university destinations. Like Jenson Burrows from UTC South Durham, who is progressing onto a degree apprenticeship with County Durham technology firm Kromek after achieving a distinction in his engineering T Level.

Or Lincoln UTC student Finlay Ingram, who achieved a merit in his engineering T Level and will be progressing to a degree apprenticeship with BAE Systems in Cumbria.

UTC Norfolk’s Katie Condie, meanwhile, will be studying biochemistry at the University of Lincoln after achieving a distinction in her science T Level.

Destinations such as these prove that T Levels can deliver the “skilled and knowledgeable workforce” that Ofqual chief regulator Sir Ian Bauckham rightly says is needed for Britain’s economic future.

To reach those destinations, students have had to complete their qualification. The latest T Level results suggest that 27 per cent left the course early, which is an improvement on the 29 per cent and 34 per cent dropout rate recorded in 2024 and 2023 respectively.

The improvement in retention is cause for celebration, as it shows T Levels work for young people and that students understand the value in their course. 

T Levels have settled into the education landscape

UTCs have dovetailed perfectly with T Levels, as they already had the employer partnerships and the strong focus on delivering high-quality technical provision to make the qualifications work.

However, it was always important that the qualifications worked well in mainstream schools and colleges to ensure their viability.

While the flexibilities introduced by DfE (such as allowing students to carry out up to 20% of their work placement remotely, and 50 per cent for digital T Level students) have been controversial, they have helped make the qualifications viable for many centres. Arguably, they have contributed to the massive increase in centres delivering T Levels. A 57.4 per cent increase, from 162 to 255 centres between 2024 and 2025, should not be discounted – it is a huge improvement.

The continued support of ministers, up to and including skills minister Baroness Smith, have also helped build momentum and confidence in the brand.

T Levels are now firmly ensconced in the education landscape as the gold-standard technical education pathway and an alternative to existing vocational and technical qualifications such as BTECs. Their cohabitation with T Levels means a wide choice of pathways for students.

What does the future hold?

The future looks bright for T Levels. They have gained acceptance and understanding in the school and college sectors. From speaking to employers, we know they have started to see they can use T Levels to pipe talented young professionals into the workplace.

We expect the retention rate will improve as providers become more confident and as employers step up their support, including in terms of the elusive industry placements.

This all bodes well for technical education in England. The continued success of T Levels will help build a skilled and knowledgeable workforce for the UK economy, while also creating parity of esteem between technical and academic routes.

We still need to tackle the high T Level dropout rate

T levels are the new flagship level 3 technical qualification in England, designed in collaboration with employers to meet the needs of industry. But they have experienced their fair share of challenges in the early stages of their rollout, including being plagued by high rates of dropout among T level starters.

Equivalent to three A Levels, T Levels combine classroom learning with a substantial industry placement, giving students the opportunity to gain real-world experience in their chosen field.

One reason for the dropouts is that the volume and complexity of content across some pathways was initially set far too high.

As the rollout continues, DfE is revising the qualifications to improve delivery and the student experience. This includes engaging in a full review of T level content over the last year in response to these high dropout rates.

But have recent changes worked?

Dropout remain higher than alternatives

On a positive note, overall T level retention has continued to rise, going from 66 per cent in 2023 to 74 per cent in 2025. This suggests that the changes made as the T level rollout progresses have had a positive impact on retention.

However, the T level dropout rate (26 per cent) remains significantly higher than the dropout rate from studying 3 A levels (10 per cent) and from similar sized VTQs (22 per cent). Given T levels are somewhat of a mix between existing VTQs and A levels, one would expect T level retention to be somewhere around the 80 to 85 per cent mark – still a way off the current state of play. While recent improvements are very welcome, it is important that the department and industry keep working on boosting T level retention.

Retention challenges remain for first-year T levels

Dropout rates vary considerably by pathway. The digital route remains the best performing pathway, delivering the lowest dropout rates in every year of T level delivery. Changes to the health and science content and assessments continue to pay dividends. Having initially suffered from an  abysmal dropout rate in 2023 (only 53 per cent of students were retained) the health and science pathway has seen its retention rate rise to 72 per cent.

Of particular concern is the low retention rate for students on the brand-new agriculture and animal care pathway (61 per cent). This highlights that new T level routes continue to face challenges with retention in their first year of delivery. It is imperative that more work is undertaken to support students in these first cohorts of new T levels and consider why dropout has been so high in some subjects.

Disadvantaged, female and white learners drop out more frequently

Our recent research has investigated the drivers of T level dropout to better understand who drops out and why. Results show that disadvantaged and female learners were significantly more likely to drop out than their peers even after controlling for prior attainment. White students were also more likely to drop out and so too were students with lower GCSE grades. 

Dropped out students at risk of going backwards or missing from education and training

One final concern is what happens to students who drop out of their T level. Are they transferring to another course? Moving to an apprenticeship? Or are they leaving education all together?

Concerningly, our research shows that more than a third of 16-year-olds who drop out of their T level in the first year go completely missing from the education and training system. Moreover, many students drop down onto a lower-level course (level 2 or below). While some students who drop out may go into skilled employment in their T level sector, these students are still missing out on a significant level 3 qualification that could open doors in their future.

Improvements in retention deserve to be celebrated. But addressing the T level drop rate out must remain a strong focus for the government. Students deserve more support in completing their T level and finding suitable destinations on other high-quality pathways if they do decide to withdraw. Given disadvantaged students tend to drop out more frequently, this yet again reiterates the urgent call for more targeted support for disadvantaged learners in post-16.

VTQ and T Level results 2025: 7 key trends

More students are achieving top grades in vocational and technical qualifications, but new data also reveals wide variations in T Level pass rates, persistent gender gaps in some subjects, and a rise in those failing to complete industry placements.

Here’s your FE Week guide to todays VTQ and T Level results…

Growing VTQ high achievers

Over 250,000 results have been issued this summer for over 230 vocational and technical qualifications (VTQs) in England. Awarding organisations handed out 239,710 level 3 VTQ grades, a 4 per cent drop from the previous year.

Business, administration, and law was the largest cohort, with 54,135 certificates awarded, a drop from 59,325 in 2023.

The majority, over 220,000, of today’s VTQ results were for applied general qualifications like BTECs, with 29,065 tech levels issued by 14 awarding organisations.

Limited results data published today show applied general qualifications (AGQs) in business, administration and law remains the most popular VTQ subject area, for the third year in a row. This was followed by AGQs in social sciences as with previous years.

Ofqual reported the number of students achieving top grades in their VTQs had increased from 8.9 per cent to 9.6 per cent. But that data isn’t published by qualification or subject, only by grading structure. The most common, with 115,850 results out today, were qualifications with pass, merit, distinction, distinction* grades and 11.9 per cent taking those achieved top grades this year, up from 11.1 per cent.

Unlike A-level and T Level results data published today, there is no comprehensive breakdown by learner characteristics such as centre type or region.

Variable T Level pass rates

According to DfE, 16,081 students started a two-year T Level in 2023, and around 10,800 received a pass or above today.

So while the reported overall pass rate improved to 91.4 per cent according to today’s provisional results data, this only includes students who completed the course. If there was an achievement rate that included those who dropped out, it would stand at around 67 per cent.

Underneath the headline figure is also a wide variation in pass rates between different T Levels.

In percentage terms, legal services had the highest pass rate, with 97.8 per cent. This course was first introduced in 2023, so this is the first year of results. Only 45 students picked up results today and 44 of those achieved at least a pass. One student scored ‘partial achievement’, meaning nobody failed.

The other new T Level to see results for the first time this year was agriculture, land management and production. Of the 165 students who got results, 89.7 per cent scored at least a pass.

Pass rates on the most popular T Level, education and early years, decreased slightly to 96.6 per cent.

But today’s results show even some established T Levels are struggling. Pass rates on digital business services plummeted, from 97.1 per cent last year to 70.9 per cent this year.

Onsite construction had a pass rate of 79.2 per cent, down slightly from 79.9 per cent, and the pass rate for design and development for engineering and manufacturing, which had 1,472 students picking up results today, was 79.4 per cent.

Down to the core

As a student, your overall T Level grade depends on what you scored in assessments for the ‘core’, which is graded A* to E, combined with results for your ‘occupational specialism’, graded as distinction, merit and pass. Those results are combined to give you a distinction*, distinction, merit or pass for your T Level, so long as you’ve completed the industry placement.

Students can walk away with a ‘partial achievement’ if they do not pass all three elements of the T Level and ‘unclassified’ if they don’t pass any elements.

The weighting attached to the core and occupational specialism towards the final grade differs between T Levels. Still with us?

For the core component – usually a written exam and employer-set project – 98.4 per cent of students passed with at least a grade E this year. Around a third achieved D grades, and another third achieved C grades, the same as last year.

Education and early years had the highest proportion of high grades in core results again this year, with 46.9 per cent achieving at least a B. Digital business services had the lowest proportion, with zero.

The occupational specialism component of a T Level is assessed through a practical project or assignments, typically taken in the second year of the T Level. Slightly more students successfully passed the occupational specialism this year; 95 per cent up from 93 per cent.

Every student who took the new legal services T Level passed their occupational specialism. There were also high pass rates in design, surveying and planning, science, health and education and early years.

The lowest occupational specialism pass rates this year were in design and development for engineering and manufacturing (82.7 per cent), onsite construction (85.6 per cent) and digital support services (87.1 per cent).

Twenty stars

Only 20 of the 11,909 students who received a T Level result today got the top distinction* grade. That’s 0.2 per cent of the cohort.

To achieve a distinction*, students need an A* for their core and a distinction for their occupational specialism.

Fifteen of those were on the education and early years T Level. Five T Levels had one distinction* student: design, surveying and planning; digital production, design and development; digital support services; health and management and administration.

Half of all T Level students achieved a merit, a quarter got a pass, and 16 per cent scored a distinction.

Nearly 1,000 students picked up a ‘partial achievement’ for their T Levels today. DfE said some of these will be students who are expected to complete their industry placement this summer. While a higher volume than last year, when 606 scored ‘partial achievement’, the proportion is almost the same at 8.3 per cent.

This year, 29 students picked up an ‘unclassified’ result, which is 0.2 per cent of the cohort, a very small reduction from last year (0.3 per cent).

Gender gaps bigger in male-heavy T Levels

Females again achieved a higher T Level pass rate than males, but the overall gap has shrunk.

Pass rate analysis also shows females are more likely to lose out in male-dominated T Levels than males are in female-dominated T Levels.

This year’s results show a pass rate of 95.1 per cent for females and 88.3 per cent for males, a 6.8 percentage point gap. Last year, the gap was 9.4 percentage points.

Beneath the headlines though, stark differences in pass rates are revealed.

The largest pass rate gaps favour males in male-dominated courses. But in female-dominated courses, the pass rate gaps are less stark.

Onsite construction had the largest pass rate gap between males and females. Figures show 80.7 per cent of males achieved at least a pass, but only 63.6 per cent of females did – a 17.1 percentage point gap.

In engineering, manufacturing, processing and control, there was a 15.9 percentage point gap favouring males.

But in education and early years, where 4 per cent of learners were male, the pass rate gap was just 0.7 percentage points in favour of females.

Ninety-three per cent of the health T Level cohort were female, but the pass rate percentage difference was a three percentage point difference favouring females.

Industry placement struggles

Students have to complete a 315-hour industry placement to achieve the full T Level. This year’s results data shows that more students struggled to complete this element of their course compared to last year.

This year, 3.7 per cent of the T Level cohort did not complete their industry placement requirement, up from 2.4 per cent last year.

Students taking the digital business services T Level appeared to have found it most difficult to complete an industry placement, with one in five of the total cohort of 55 students not completing.

For building services T Levels, which topped the placement non-completion table last year, 11 per cent of the 539 students did not complete, a slight improvement on last year’s results.

By contrast, just one of the 200 students who completed the science T Level, and just 48 – or 1.9 per cent – of the 2,488 education and early years T Level students did not complete their placement.

Huge T Levels growth in the West Mids

Today’s data shows substantial growth in T Levels being taught in the West Midlands and in London.

The North West continues to dominate the regional table. The number of T Level results are up 47 per cent this year to 2,145. The South East retains second place with 1,872, up 40 per cent.

But the West Midlands has jumped from fifth to third, growing the number of T Level results from 731 last year to 1,582 this year, a 116 per cent increase.

London’s T Level numbers have nearly doubled. This year 985 learners were awarded T Level results, up from 499 last year.

Results day data does not break down T Level performance by region.

A-level results 2025: 8 key trends in England’s data

A-level results are out this morning – here’s your handy FE Week round up of the key trends.

All findings are for students in England, unless stated. Here’s what we know…

1. Top grades up … again

The proportion of A* and A grades has risen slightly to 28.2 per cent, up from 27.6 per cent last year, a rise of 2.2 per cent.

This means the gap between top grades pre- and post-Covid has been extended. The figure stood at 25.2 per cent in 2019.

This year, 77.7 per cent of grades were C or above, up on 76 per cent last year and 75.5 per cent in pre-pandemic 2019.

2. Drop in students getting 3 A*s

The number of students achieving 3 A* grades has fallen slightly – from 4,136 to 4,043. This comes after an 8 per cent rise in students hitting the milestone last year.

Despite this, it remains 45 per cent up on pre-pandemic 2019 – when 2,785 pupils achieved it.

However, this year’s figure is still way down on the 12,975 pupils achieving 3 A*s in 2021, when teacher grades were awarded.

3. Grade distribution compared to 2019

4. The widening regional attainment gap

The regional gap has widened, continuing its post-pandemic growth.

The proportion of A and above grades in London was 32.1 per cent. In the south east, it was 31.2 per cent. This is compared to 22.9 per cent in the north east and 23.8 per cent in the east Midlands.

Just two regions saw their proportion of top grades fall this year.

The north east registered a 1 percentage point drop and the west Midlands a 0.6 percentage point dip. This is despite the areas registering the largest rises last year (both 1.9 percentage points).

However, the largest rise was in the north west. It was the only region with an increase of more than 1 percentage point.

5. History drops out of top 5

For the first time in years, the UK’s top five most popular subjects have changed.

History dropped from fifth to seventh, with entries falling by 5.5 per cent from 47,297 to 44,717.

It was overtaken by business studies and physics, which moved into fifth and sixth respectively. The rest of the top five remained unchanged.

Once again, further maths saw the largest rise in entries of any A-level subject. The number entries grew by 7.2 per cent, from 18,082 in 2024, to 19,390.

Economics, mathsphysics and chemistry also recorded increases of more than 4 per cent.

6. Computing down for first time, big falls for French

Meanwhile, French witnessed the largest drop (9.1 per cent), with entries shrinking from 7,544 last year to 6,858. Drama and English language and literature were the only others to register dips of more than 6 per cent.

But computing – which has seen entries rise every year since 2015 – registered a drop of 2.8 per cent. Number decreased from 20,370 to 19,796.

7. Boys overtake girls in top grades

Prior to this year, the gap between girls and boys in England achieving A or above had narrowed since Covid.

In 2021, the gap stood at 4.7 percentage points, with entries from girls receiving 46.4 per cent of top grades, compared to 41.7 per cent for boys. Last year, the gap was just 0.4 percentage points.

But for the first time since 2019, boys have overtaken girls. In 2025, 28.4 per cent of boys achieved A or above, compared to 28 per cent of girls.

Boys continue to achieve more A*s also, with 9.8 per cent compared to 9.1 of girls.

The gender gap in entries is widest in computing and physics, with boys accounting for around three-quarters of entries.

Girls continue to be dominate health and social care and performing/expressive arts.

8. How results vary by school and college type

According to data published by Ofqual today, independent schools, including city training colleges, registered the highest proportion of top grades (48.4 per cent).

But this fell slightly since last year, when the figure stood at 49.4 per cent.

Across all state-funded schools 25.2 per cent of A-levels results were A and above. The figure was 23.1 per cent for academies and 31.3 per cent free schools.

This compares to just 14.4 per cent in FE colleges – a fall of 0.4 percentage points since last year – and 16.3 in secondary moderns, which are non-selective schools in areas with grammar schools.

Almost 44 per cent of grades in selective secondaries were A and above

A-level results 2025: Top grades rise slightly again this year

The proportion of top A-level grades achieved by students in England has risen slightly again this year – with boys outscoring girls for the first time since the pandemic hit.This year, 28.2 per cent of grades were A or above, up from 27.6 per cent last year (a 2 per cent rise). That also marks a 12 per cent rise than the 25.2 per cent in pre-pandemic 2019.    The proportion of A* grades is largely the same (9.4 per cent this year compared to 9.3 per cent in 2023). However, this is still 22 per cent up on 2019. 

Meanwhile, the gap between the top and lowest attaining regions has also risen.

‘Stronger cohort’ behind results rise

In a blog published this morning, the regulator said they “can’t say for sure” why there has been an increase in pass rates.

The proportion of C and above grades also rose from 76 per cent in 2024, to 77.7per cent this year – a two per cent rise.

But Amanda Swann, executive director for General Qualifications at Ofqual, added prior attainment suggested this year’s A-level cohort “seems to be stronger than last year’s”.

This year’s students also made their A-level choices in 2023 – which was the first year GCSE grading returned to normal.

“That could mean those students had a more accurate picture of their strengths to guide their choices,” Swann added.

‘Students made better choices’

“We can’t be certain, but it may be that some students who might have taken A-levels in previous years instead opted for some of the level 3 vocational options, such as applied general qualifications (for example BTECs) or T-levels.”

Despite a rise in the number of 18-year-olds this year, the number of pupils taking A-levels has remained similar.

The number of A-levels taken has fallen slightly from 816,948 in 2024, to 814,224 (2,724 fewer, 0.3 per cent) – bucking a trend of entries rising steadily over previous years.

However the number of students completing T-levels this summer increased by 60 per cent up to 11,909. 

But Swann added “any change in numbers achieving a grade is entirely due to a change in student performance, not a change in the standard expected”.

Ofqual said last year that results achieved in 2023 will now be the “baseline” for future grading standards.

However, despite attempts to unwind grade inflation from Covid years, results in 2023 were still higher than in 2019 – suggesting the post-pandemic grading standard is now more generous.

But Ofqual chief regulator Sir Ian Bauckham said: “Standards have been maintained for another year, with grades determined by students’ performance in exams using exam boards’ strict marking and grading processes.”

Regional gap widens

However, two regions in England saw results top results fall. The proportion of A and above grades in the north east fell to 22.9 per cent, down from 23.9 per cent in 2024. The west Midlands also saw top grades fall to 24.2 per cent, down from 24.8 per cent in 2024.

The east Midlands and the north west saw the biggest rise in top grades.

It means the gap between the north east, the lowest-attaining region, and London, the highest attaining, is now 9.2 percentage points.

This is wider than the gap between the best- and lowest-attaining regions last year, which was 8.8 percentage points.                                

Pepe Di’Iasio, general secretary of the Association of School and College Leaders, said the “big differences” reflect “socioeconomic factors which represent a massive challenge, not only for the education sector but our society as a whole”.

“We have to stop merely talking about these issues and actually address them with investment in communities suffering from generational disadvantage.”

University rates up for poorer pupils

The proportion of youngsters securing a university place has risen from 32.1 per cent in 2024 to 32.5 per cent this year. And the proportion of students from the poorest backgrounds getting a place is also up from 19.4 per cent last year to 20 per cent.

However, the university entry rate for students from the richest backgrounds has flatlined (falling slightly from 45.9 per cent to 45.8 per cent).

Education secretary Bridget Phillipson said “today is a time for celebration as young people up and down the country collect their exam results”. 

But she added:“Every young person should have the opportunity to achieve and thrive. This government won’t stand by and accept the entrenched inequalities that continue to blight the life chances of too many young people, especially those from white working class backgrounds who have long been overlooked.”

T Level results 2025: Pass rate up and dropouts down

The T Level pass rate has risen above 91 per cent while the proportion of students dropping out has continued to shrink.

A total of 11,724 learners from the fourth wave of T Levels received results this morning compared to the 16,081 who started the 2023 cohort.

It suggests 27 per cent left the course early. This is an improvement on the 29 per cent and 34 per cent dropout rate that was recorded in 2024 and 2023 respectively.

Dropout rates for those who took three A-levels last year were 10 per cent.

Meanwhile, the overall pass rate on T Levels has jumped to 91.4 per cent, up from 88.7 per cent in 2024. The total number of students in receipt of T Level results today was 11,909, which includes 185 from an earlier cohort.

Ofqual chief regulator Sir Ian Bauckham told FE Week a pass rate “in the 90s is an important threshold”.

“It will be great if we can move a bit further in that direction, so that when students spend two years studying for a T Level, they do come away with a grade,” he added.

T Levels were introduced in 2020 as the government’s new “gold standard” two-year qualifications that are meant to be the technical equivalent of A-levels.

A T Level has three parts – the core component involving an exam and employer set project, the occupational specialism where practical skills are tested and a minimum 315-hour, or 45-day, industry placement.

Today’s results cover 18 individual T Levels, two of which are awarded for the first time this year – legal and agriculture.

The number of students receiving results has risen 61.4 per cent from 7,380 in 2024 to 11,909 in 2025, while the number of schools and colleges offering T Levels has increased 57.4 per cent from 162 to 255.

The proportion of students that achieved the top two grades of distinction* or distinction fell marginally from 15.9 per cent to 15.7 per cent.

But merits were handed out to 49.6 per cent compared to 46.8 per cent the year before, and the proportion receiving a pass was 26.1 per cent compared to 25.9 per cent in 2024.

And 8.3 per cent of students received a “partial achievement” this year – which is where a learner attempts all elements of the T Levels but does not achieve all of them – down from 11.1 per cent in 2024.

The Joint Council for Qualifications only releases partial T Level data to journalists before 9.30am on results day, unlike A-levels which benefit from a full analysis.

The Department for Education will publish full T Level data later this morning, which includes breakdown by gender, region and other granular data including industry placement completions.

Results data for other vocational and technical qualifications like BTECs, which are sat by hundreds of thousands of students, is also sparse. Figures for these courses are due to be published later today.

Bauckham said: “Britain’s economic future depends on a skilled and knowledgeable workforce. All types of qualifications open doors of opportunity to students to contribute towards Britain’s economy.

“Whether students are using their results to continue in education or move into the workplace, they can be confident that they have qualifications that will stand them in good stead for their future.”