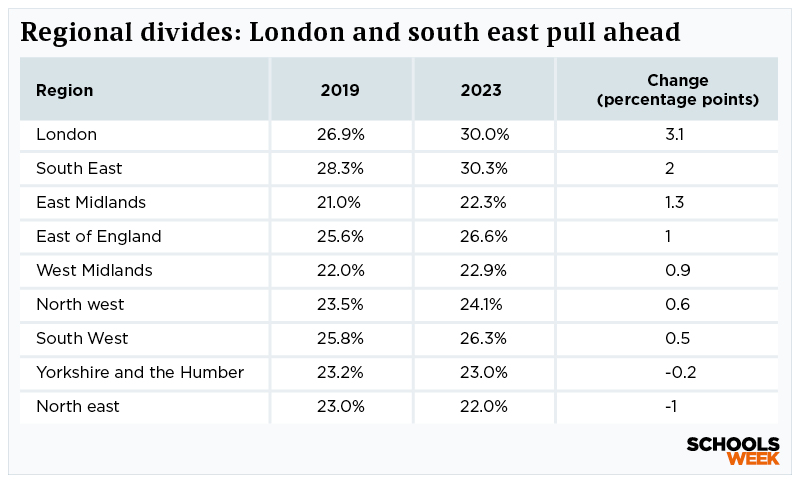
Students in London and the south east recorded the largest rise in top A-level results compared to 2019 as grade standards settled back to the new post-pandemic normal, with those in the north east hardest-hit.
Results this year have mostly returned to pre-pandemic standards after three years of grade inflation following the cancelation of exams.
However the regional picture varies.
The north east now has the lowest proportion of A* or A grades (22 per cent).
It has been surpassed by both the east and West Midlands, whose top grades rose to 22.3 per cent and 22.9 per cent respectively.
Both the north east and Yorkshire and the Humber have a lower proportion of top grades this year than in 2019.
Comparing top grades this year to 2019, London and the south east have recorded the biggest rises.

It means the gap between the two top-performing regions and the rest of the country has widened this year.
After a similar trend last year, regional spokespeople said the disparities are down to the “disproportionate impact of the pandemic facing regions like the north east”.
We don’t have attendance data for year 13 pupils. However, the changes do seem to mirror attendance rates for year 11 pupils in a study by Education Datalab.
London year 11s had the best attendance rates, while those in the north east had among the worst. However, the south east also had relatively high absence rates, according to the analysis.


Are we really hiding behind the pandemic for the North/South divide? It was there pre-pandemic.
I think this is just demonstrating there is something wrong with the funding formulas. Unfortunately after decades of this there will be an inequality of teaching ability on top so it will take a long time to fix.
A start would be looking at area cost and disadvantaged funding.
London and “surrounding areas” as far as Peterborough are getting area cost uplifts as high as 20% in funding. These may be based on additional salary expenses but don’t seem to reflect the reality of running services. Council Tax for instance is lower in cities because it is cheaper to run the services than in rural areas. Conflating a high cost of living directly to additional service costs is a fundamental mistake.
Example £4,753 national rate * 1.2 area cost = £5,703 or £951 more per pupil. With an average class size of say 22 that means £21k extra per class in London. This doesn’t seem to match the additional salary expenses for London nor does any other city get an uplift (if they really need it). Leeds, Nottingham, Liverpool, Birmingham, Manchester… all have higher cost of living than Peterborough yet get no extra funding.
As for disadvantage funding if you look at the map you will see a lot of London is also receiving it on top of area cost factors while many rural areas have no uplift. Surely the results demonstrate this is unnecessary and that funding could be better used elsewhere. Maybe its time funding targets areas with poor results.