A-level results are out this morning – here’s your handy FE Week round up of the key trends.
All findings are for students in England, unless stated. Here’s what we know…
1. Top grades up … again
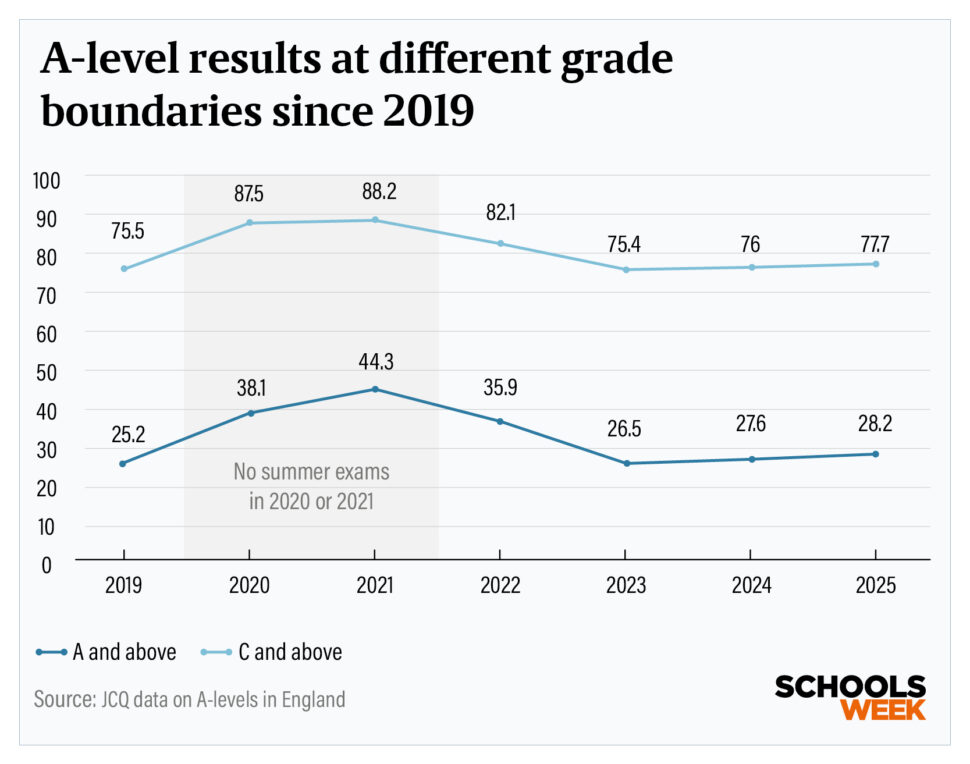
The proportion of A* and A grades has risen slightly to 28.2 per cent, up from 27.6 per cent last year, a rise of 2.2 per cent.
This means the gap between top grades pre- and post-Covid has been extended. The figure stood at 25.2 per cent in 2019.
This year, 77.7 per cent of grades were C or above, up on 76 per cent last year and 75.5 per cent in pre-pandemic 2019.

2. Drop in students getting 3 A*s
The number of students achieving 3 A* grades has fallen slightly – from 4,136 to 4,043. This comes after an 8 per cent rise in students hitting the milestone last year.
Despite this, it remains 45 per cent up on pre-pandemic 2019 – when 2,785 pupils achieved it.
However, this year’s figure is still way down on the 12,975 pupils achieving 3 A*s in 2021, when teacher grades were awarded.
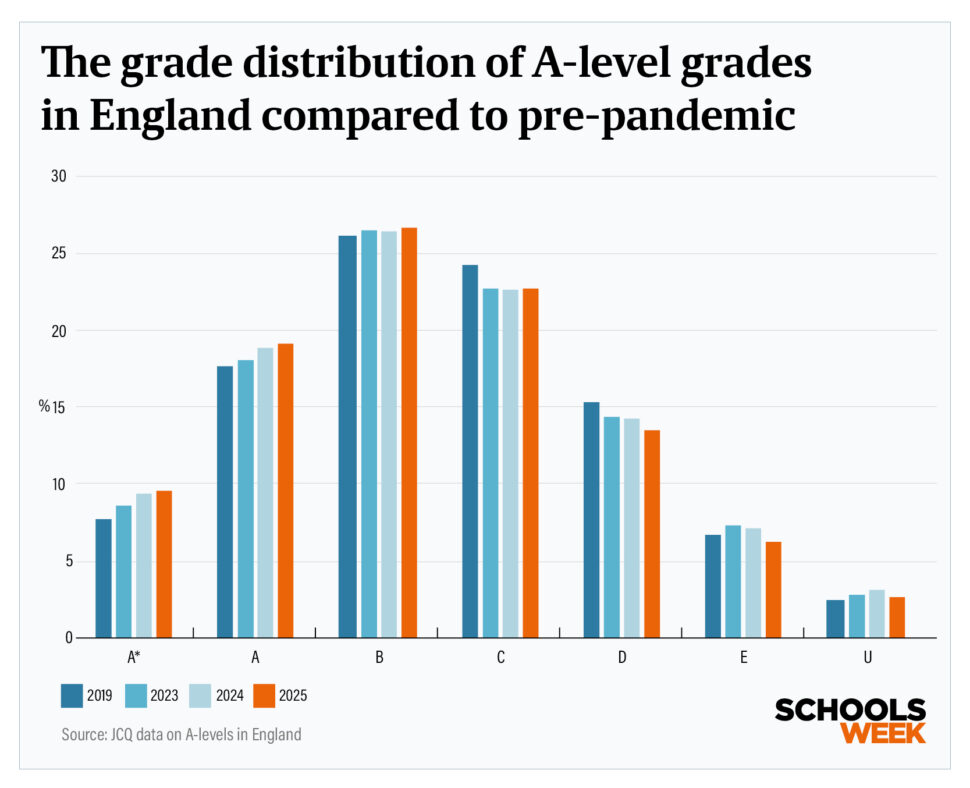
3. Grade distribution compared to 2019

4. The widening regional attainment gap
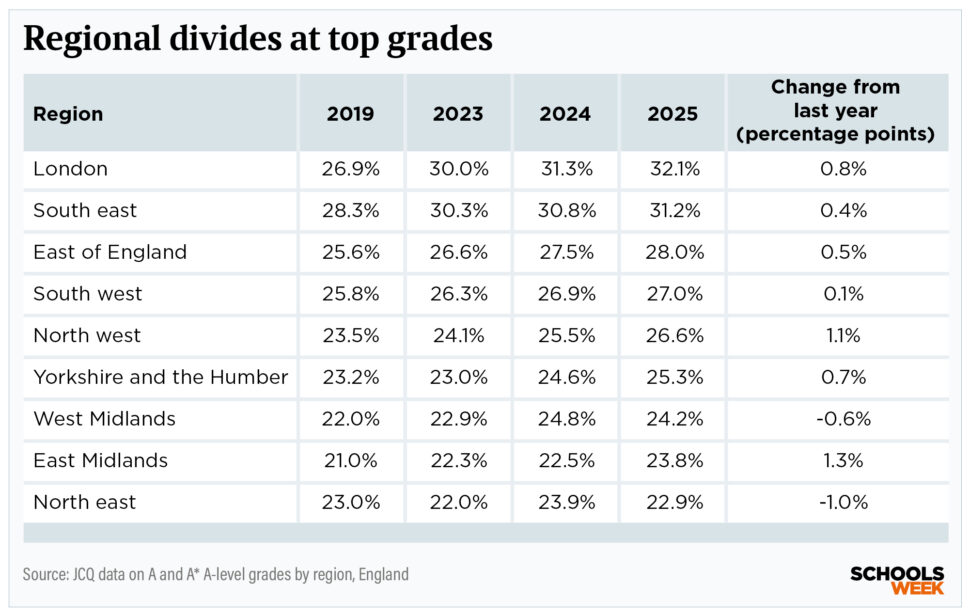
The regional gap has widened, continuing its post-pandemic growth.
The proportion of A and above grades in London was 32.1 per cent. In the south east, it was 31.2 per cent. This is compared to 22.9 per cent in the north east and 23.8 per cent in the east Midlands.
Just two regions saw their proportion of top grades fall this year.
The north east registered a 1 percentage point drop and the west Midlands a 0.6 percentage point dip. This is despite the areas registering the largest rises last year (both 1.9 percentage points).
However, the largest rise was in the north west. It was the only region with an increase of more than 1 percentage point.

5. History drops out of top 5
For the first time in years, the UK’s top five most popular subjects have changed.
History dropped from fifth to seventh, with entries falling by 5.5 per cent from 47,297 to 44,717.
It was overtaken by business studies and physics, which moved into fifth and sixth respectively. The rest of the top five remained unchanged.
Once again, further maths saw the largest rise in entries of any A-level subject. The number entries grew by 7.2 per cent, from 18,082 in 2024, to 19,390.
Economics, maths, physics and chemistry also recorded increases of more than 4 per cent.

6. Computing down for first time, big falls for French
Meanwhile, French witnessed the largest drop (9.1 per cent), with entries shrinking from 7,544 last year to 6,858. Drama and English language and literature were the only others to register dips of more than 6 per cent.
But computing – which has seen entries rise every year since 2015 – registered a drop of 2.8 per cent. Number decreased from 20,370 to 19,796.
7. Boys overtake girls in top grades
Prior to this year, the gap between girls and boys in England achieving A or above had narrowed since Covid.
In 2021, the gap stood at 4.7 percentage points, with entries from girls receiving 46.4 per cent of top grades, compared to 41.7 per cent for boys. Last year, the gap was just 0.4 percentage points.
But for the first time since 2019, boys have overtaken girls. In 2025, 28.4 per cent of boys achieved A or above, compared to 28 per cent of girls.
Boys continue to achieve more A*s also, with 9.8 per cent compared to 9.1 of girls.
The gender gap in entries is widest in computing and physics, with boys accounting for around three-quarters of entries.
Girls continue to be dominate health and social care and performing/expressive arts.
8. How results vary by school and college type
According to data published by Ofqual today, independent schools, including city training colleges, registered the highest proportion of top grades (48.4 per cent).
But this fell slightly since last year, when the figure stood at 49.4 per cent.
Across all state-funded schools 25.2 per cent of A-levels results were A and above. The figure was 23.1 per cent for academies and 31.3 per cent free schools.
This compares to just 14.4 per cent in FE colleges – a fall of 0.4 percentage points since last year – and 16.3 in secondary moderns, which are non-selective schools in areas with grammar schools.
Almost 44 per cent of grades in selective secondaries were A and above.


Your thoughts