Results from the first formal A-level exams held since 2019 have been published.
Here’s what we know…
1. Overall performance in England
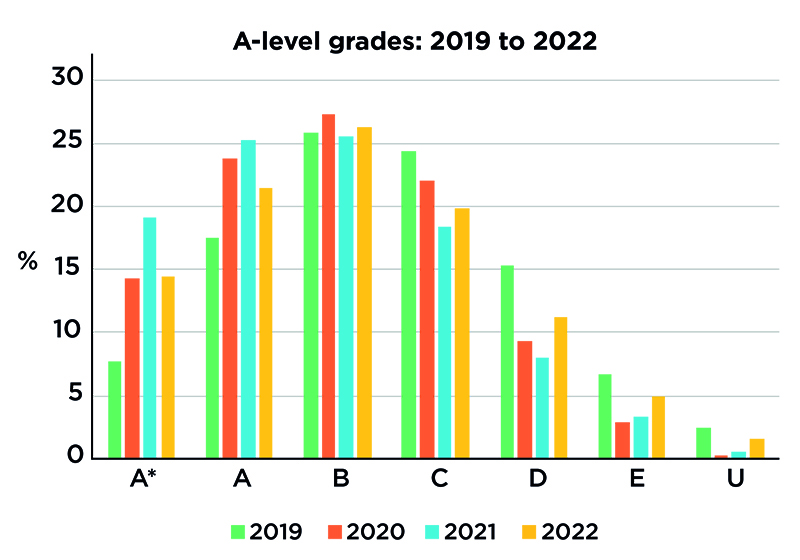
The proportion of A* and A grades has dropped this year compared to 2021 (when teacher-assessed grades were used) from 44.3 per cent to 35.9 per cent. However, this is still way above the 25.2 per cent getting top grades in 2019.
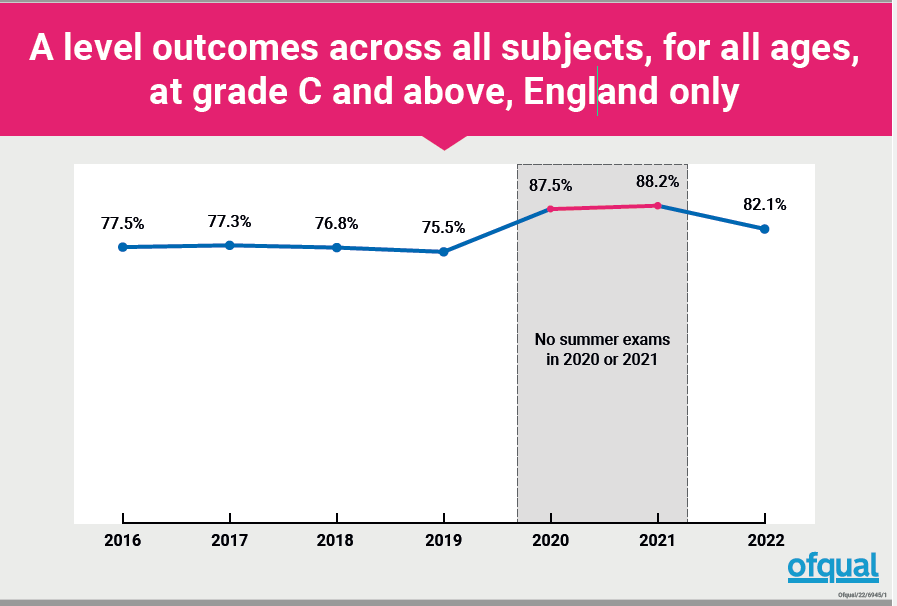
For grade C and above, 82.1 per cent achieved this this year compared to 88.2 per cent in 2021 and 75.5 per cent in 2019.
However, the number of A-level students who achieved 3 A* grades has remained high at 8,570 but dropped a third from 2021 at 12,865. It’s still higher than 2020 – 7,775 – and much higher than 2019 – 2,785.
2. A-level grade distribution: 2019 to 2022
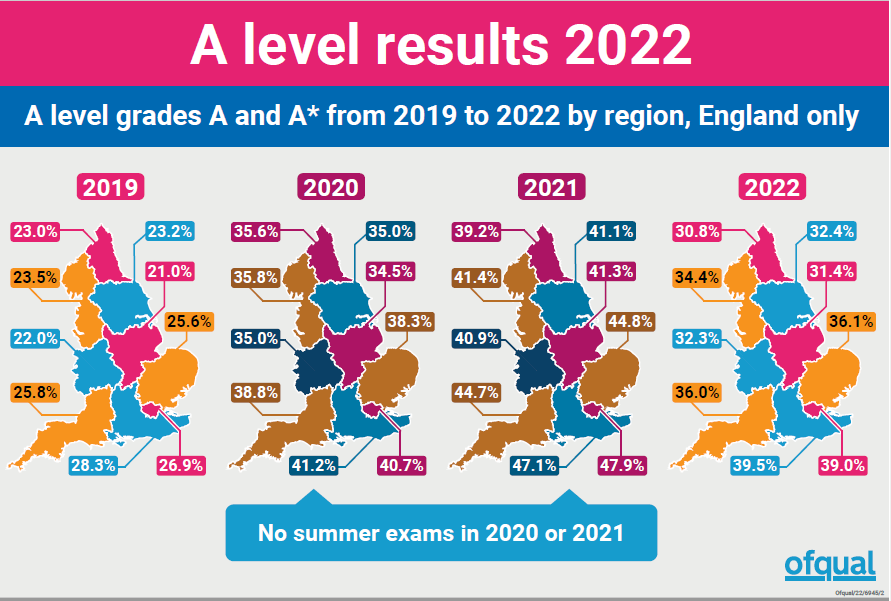
3. North-south divide widens
London has seen the sharpest rise in top grades since 2019 – rising 12.1 percentage points from 26.9 to 39 per cent. However, the north east has only seen a 7.8 percentage point increase from 23.0 to 30.8.
It is bound to raise questions about whether this was down to the pandemic, which hit some areas harder than others.
4. FE colleges see biggest drop in top grades
Ofqual data shows private students in FE establishments saw the biggest drop in top grades following the reintroduction of summer exams.
The proportion of candidates awarded an A and above in all subjects fell by 12.7 percentage points. Independent schools saw the next biggest drop – 12.4 percentage points.
Despite this, the proportion of top grades awarded was once again highest in private schools. This year, 58 per cent of grades issued to private school pupils were As or above, down from 70.4 per cent last year but up from 44.7 per cent in 2019.
In comparison, the proportion of top grades was 50.4 per cent in grammar schools, 45 per cent in free schools, 35 per cent in academies, 31.9 per cent in sixth form colleges and 30.7 per cent in comprehensive schools.
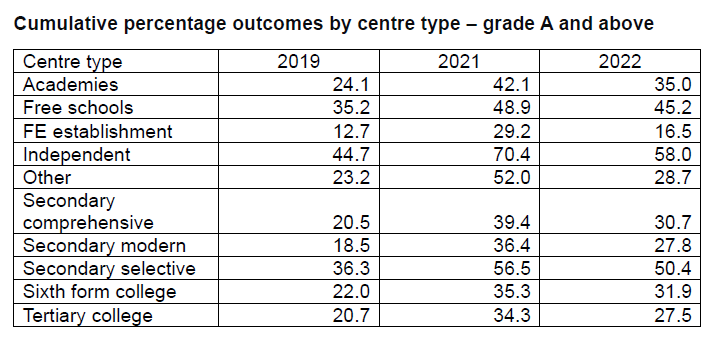
The lowest proportions of top grades were issued in secondary modern schools, which are non-selective schools in selective areas, at 27.8 per cent, tertiary colleges (27.5 per cent) and FE establishments (16.5 per cent).
5. Which subjects are gaining/losing popularity?
Across the UK, there has been no change to the top five most popular subjects. But some subjects have increased in popularity while others have fallen.
Design and technology saw the biggest increase in entries, up by 14.3 per cent this year, closely followed by computing (13.5 per cent), PE (11.4 per cent) and political studies (11 per cent).
English literature saw the biggest decrease, with entries falling by 9.4 per cent. It dropped out of the 10 most popular subjects for the first time, replaced by geography.
English language and literature entries dropped by 5.8 per cent and French fell by 5.4 per cent. Entries to further maths also dropped by 3.8 per cent.
6. Which subjects have the biggest gender gap in entries?
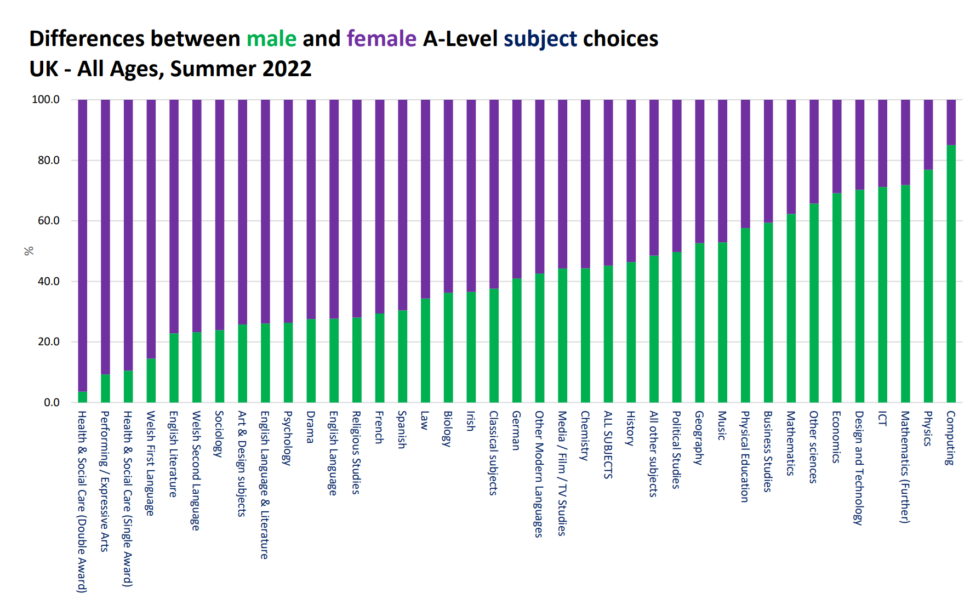
JCQ has published data on the differences between boys’ and girls’ A-level subject choices, which as ever makes for interesting reading.
Computing continues to have far more entries from boys, who make up more than eight in 10 entrants, while physics, further maths, ICT and design and technology are also much more popular among boys than girls.
At the other end of the scale, performing and expressive arts, English literature, sociology and art and design subjects had much higher entries from girls than boys.






Your thoughts