More students are achieving top grades in vocational and technical qualifications, but new data also reveals wide variations in T Level pass rates, persistent gender gaps in some subjects, and a rise in those failing to complete industry placements.
Here’s your FE Week guide to todays VTQ and T Level results…
Growing VTQ high achievers
Over 250,000 results have been issued this summer for over 230 vocational and technical qualifications (VTQs) in England. Awarding organisations handed out 239,710 level 3 VTQ grades, a 4 per cent drop from the previous year.
Business, administration, and law was the largest cohort, with 54,135 certificates awarded, a drop from 59,325 in 2023.
The majority, over 220,000, of today’s VTQ results were for applied general qualifications like BTECs, with 29,065 tech levels issued by 14 awarding organisations.
Limited results data published today show applied general qualifications (AGQs) in business, administration and law remains the most popular VTQ subject area, for the third year in a row. This was followed by AGQs in social sciences as with previous years.
Ofqual reported the number of students achieving top grades in their VTQs had increased from 8.9 per cent to 9.6 per cent. But that data isn’t published by qualification or subject, only by grading structure. The most common, with 115,850 results out today, were qualifications with pass, merit, distinction, distinction* grades and 11.9 per cent taking those achieved top grades this year, up from 11.1 per cent.
Unlike A-level and T Level results data published today, there is no comprehensive breakdown by learner characteristics such as centre type or region.
Variable T Level pass rates
According to DfE, 16,081 students started a two-year T Level in 2023, and around 10,800 received a pass or above today.
So while the reported overall pass rate improved to 91.4 per cent according to today’s provisional results data, this only includes students who completed the course. If there was an achievement rate that included those who dropped out, it would stand at around 67 per cent.
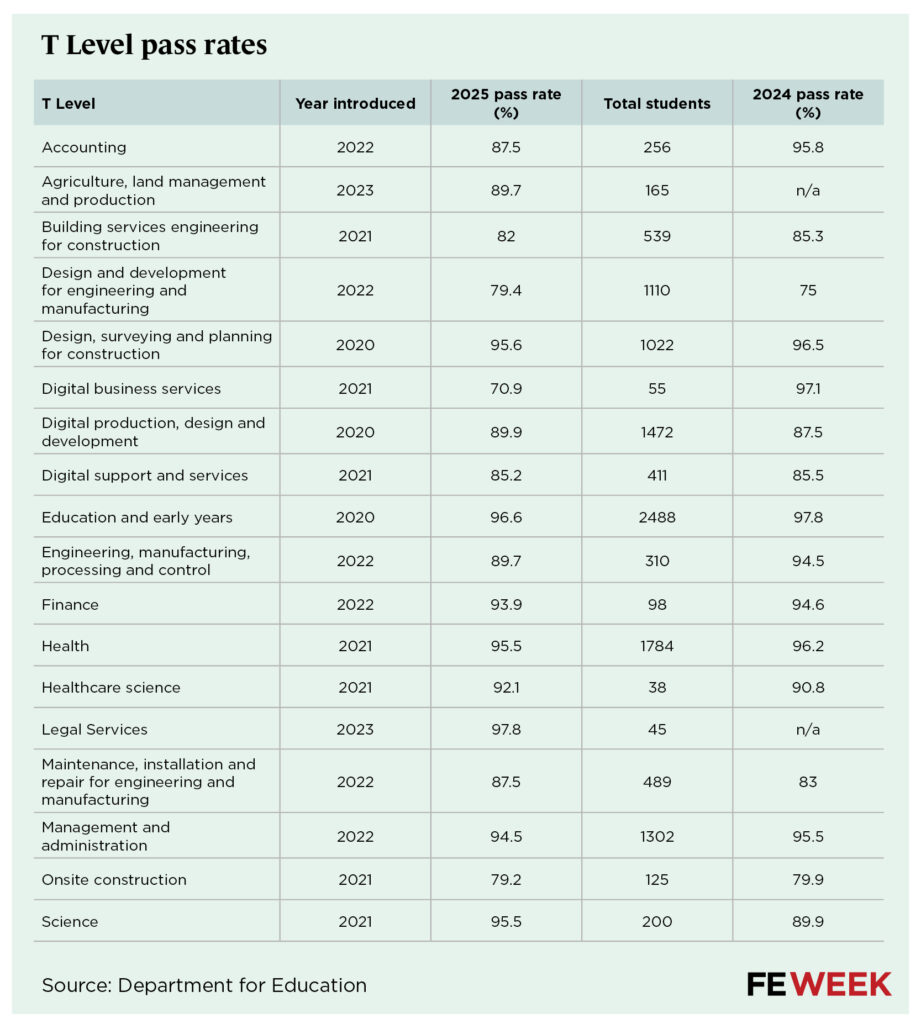
Underneath the headline figure is also a wide variation in pass rates between different T Levels.
In percentage terms, legal services had the highest pass rate, with 97.8 per cent. This course was first introduced in 2023, so this is the first year of results. Only 45 students picked up results today and 44 of those achieved at least a pass. One student scored ‘partial achievement’, meaning nobody failed.
The other new T Level to see results for the first time this year was agriculture, land management and production. Of the 165 students who got results, 89.7 per cent scored at least a pass.
Pass rates on the most popular T Level, education and early years, decreased slightly to 96.6 per cent.
But today’s results show even some established T Levels are struggling. Pass rates on digital business services plummeted, from 97.1 per cent last year to 70.9 per cent this year.
Onsite construction had a pass rate of 79.2 per cent, down slightly from 79.9 per cent, and the pass rate for design and development for engineering and manufacturing, which had 1,472 students picking up results today, was 79.4 per cent.
Down to the core
As a student, your overall T Level grade depends on what you scored in assessments for the ‘core’, which is graded A* to E, combined with results for your ‘occupational specialism’, graded as distinction, merit and pass. Those results are combined to give you a distinction*, distinction, merit or pass for your T Level, so long as you’ve completed the industry placement.
Students can walk away with a ‘partial achievement’ if they do not pass all three elements of the T Level and ‘unclassified’ if they don’t pass any elements.
The weighting attached to the core and occupational specialism towards the final grade differs between T Levels. Still with us?
For the core component – usually a written exam and employer-set project – 98.4 per cent of students passed with at least a grade E this year. Around a third achieved D grades, and another third achieved C grades, the same as last year.
Education and early years had the highest proportion of high grades in core results again this year, with 46.9 per cent achieving at least a B. Digital business services had the lowest proportion, with zero.
The occupational specialism component of a T Level is assessed through a practical project or assignments, typically taken in the second year of the T Level. Slightly more students successfully passed the occupational specialism this year; 95 per cent up from 93 per cent.
Every student who took the new legal services T Level passed their occupational specialism. There were also high pass rates in design, surveying and planning, science, health and education and early years.
The lowest occupational specialism pass rates this year were in design and development for engineering and manufacturing (82.7 per cent), onsite construction (85.6 per cent) and digital support services (87.1 per cent).
Twenty stars
Only 20 of the 11,909 students who received a T Level result today got the top distinction* grade. That’s 0.2 per cent of the cohort.
To achieve a distinction*, students need an A* for their core and a distinction for their occupational specialism.
Fifteen of those were on the education and early years T Level. Five T Levels had one distinction* student: design, surveying and planning; digital production, design and development; digital support services; health and management and administration.
Half of all T Level students achieved a merit, a quarter got a pass, and 16 per cent scored a distinction.
Nearly 1,000 students picked up a ‘partial achievement’ for their T Levels today. DfE said some of these will be students who are expected to complete their industry placement this summer. While a higher volume than last year, when 606 scored ‘partial achievement’, the proportion is almost the same at 8.3 per cent.
This year, 29 students picked up an ‘unclassified’ result, which is 0.2 per cent of the cohort, a very small reduction from last year (0.3 per cent).
Gender gaps bigger in male-heavy T Levels
Females again achieved a higher T Level pass rate than males, but the overall gap has shrunk.
Pass rate analysis also shows females are more likely to lose out in male-dominated T Levels than males are in female-dominated T Levels.
This year’s results show a pass rate of 95.1 per cent for females and 88.3 per cent for males, a 6.8 percentage point gap. Last year, the gap was 9.4 percentage points.
Beneath the headlines though, stark differences in pass rates are revealed.
The largest pass rate gaps favour males in male-dominated courses. But in female-dominated courses, the pass rate gaps are less stark.
Onsite construction had the largest pass rate gap between males and females. Figures show 80.7 per cent of males achieved at least a pass, but only 63.6 per cent of females did – a 17.1 percentage point gap.
In engineering, manufacturing, processing and control, there was a 15.9 percentage point gap favouring males.
But in education and early years, where 4 per cent of learners were male, the pass rate gap was just 0.7 percentage points in favour of females.
Ninety-three per cent of the health T Level cohort were female, but the pass rate percentage difference was a three percentage point difference favouring females.
Industry placement struggles
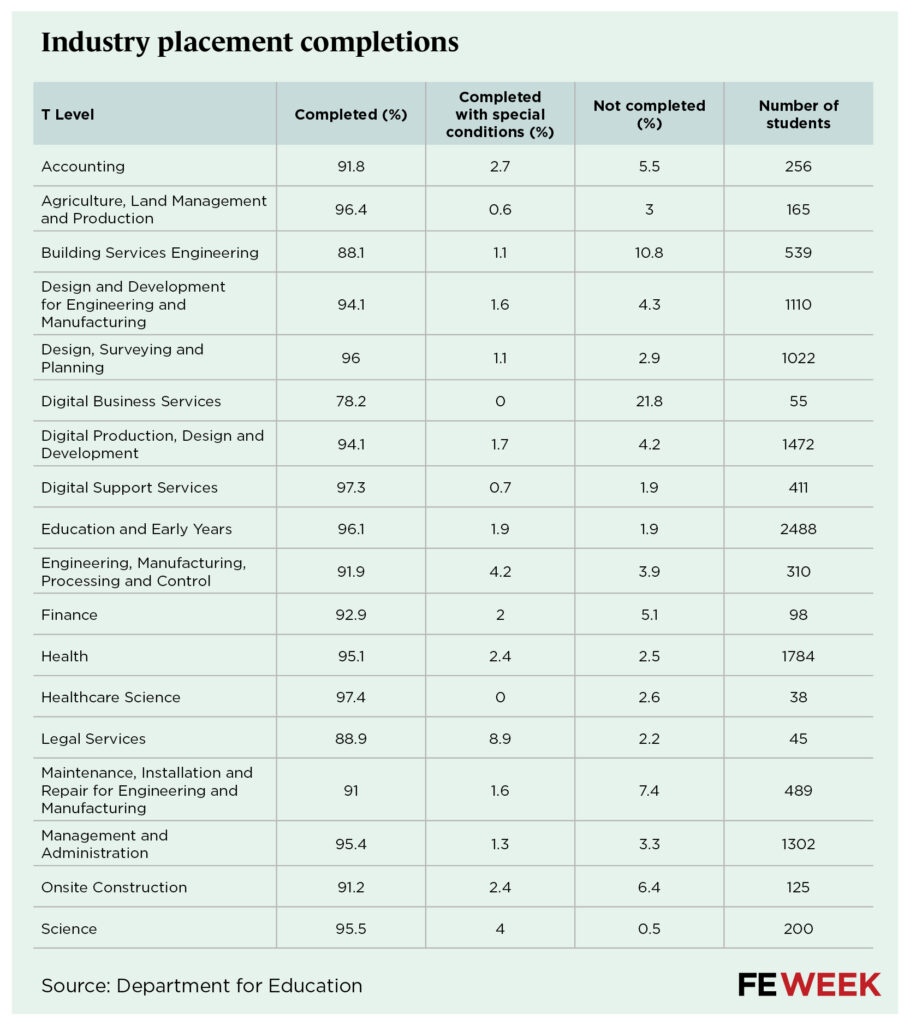
Students have to complete a 315-hour industry placement to achieve the full T Level. This year’s results data shows that more students struggled to complete this element of their course compared to last year.
This year, 3.7 per cent of the T Level cohort did not complete their industry placement requirement, up from 2.4 per cent last year.
Students taking the digital business services T Level appeared to have found it most difficult to complete an industry placement, with one in five of the total cohort of 55 students not completing.
For building services T Levels, which topped the placement non-completion table last year, 11 per cent of the 539 students did not complete, a slight improvement on last year’s results.
By contrast, just one of the 200 students who completed the science T Level, and just 48 – or 1.9 per cent – of the 2,488 education and early years T Level students did not complete their placement.
Huge T Levels growth in the West Mids
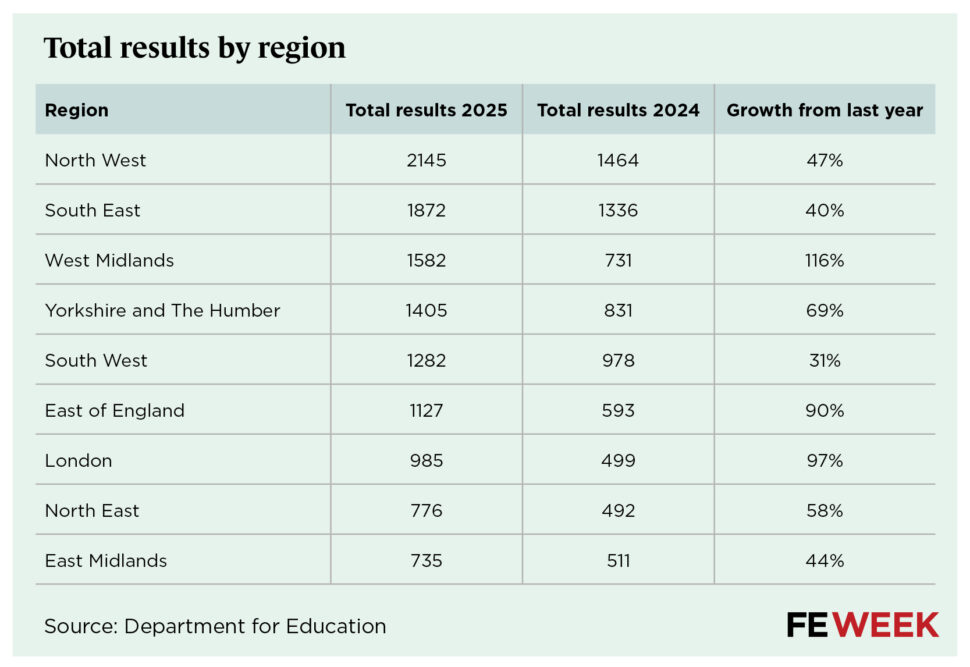
Today’s data shows substantial growth in T Levels being taught in the West Midlands and in London.
The North West continues to dominate the regional table. The number of T Level results are up 47 per cent this year to 2,145. The South East retains second place with 1,872, up 40 per cent.
But the West Midlands has jumped from fifth to third, growing the number of T Level results from 731 last year to 1,582 this year, a 116 per cent increase.
London’s T Level numbers have nearly doubled. This year 985 learners were awarded T Level results, up from 499 last year.
Results day data does not break down T Level performance by region.







An increase in Students this year not completing the placement, maybe because DofE withdrew all business funding support , ESF, and so many SMEs walked away because of it , therefore huge problem finding placements, maybe just maybe!
This year the placements are in total chaos, we have been offered £80 a student in support by one college, that is not a typo, 80.
Other colleges say they can’t even do the 800 and offer far smaller amounts which don’t even scratch the surface of the SMEs costs.
4 years ago they offered 1000 but now it is 800 or a lot worse , why do they treat business so badly? Placements are essential yet they refuse to be even remotely fair to business, in the guidance it says businesses are expected to give all of their time for free, so our time in their eyes has no value, sums up how they treat SMEs, shocking.